Featured Stock Spotlight: Idexx Laboratories
Today, we’re going to highlight what we believe is one of the most powerful
indicators available to traders – the 2-Period RSI.
Click here to go deeper into the research.
Today, we will provide free open access to one of our proprietary stock
indicator lists. These indicators are backed by millions of trades within our
historically quantified database. We have established clear, distinguishable
historical probabilities to provide traders with a short-term edge.
Click here to view today’s
2-Period RSI Below 2 list. These are stocks that have a 2-period RSI reading below 2 and are trading
above their 200-day moving average. Our research shows that stocks
trading above their 200-day moving with a 2-period RSI reading below 2 have
shown positive returns, on average, 1-week later. Historically, these
stocks have provided traders with a significant edge.
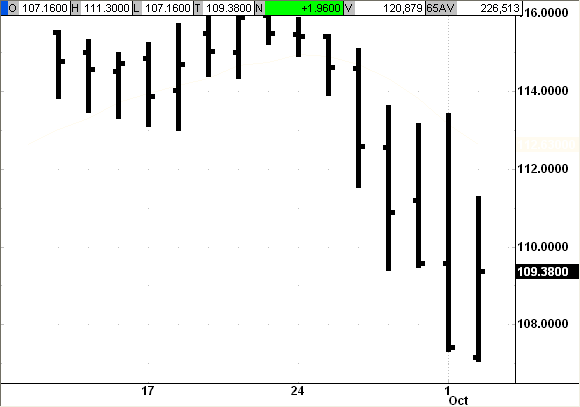
Idexx Laboratories
(
IDXX |
Quote |
Chart |
News |
PowerRating)

Idexx Laboratories (IDXX) is trading above its 200-day moving average,
in a confirmed uptrend. Simply put, this stock has risen more over the last 200
days than it has fallen. By technical definition, this is a strong stock in an
uptrend. IDXX sold off towards the end of August, falling more than 6% in just a
few days.. The TradingMarkets mantra is to “buy weakness, and sell strength,” and
that’s what we would be looking to do right here. Our database of literally
millions of trades confirms that an edge to the long side exists when a strong
stock pulls back to extended, weak levels.
