Fed and Central Banks Driving Market
From 1990 to 1997, Kevin Haggerty served as Senior Vice President for Equity Trading at Fidelity Capital Markets, Boston, a division of Fidelity Investments. He was responsible for all U.S. institutional Listed, OTC and Option trading in addition to all major Exchange Floor Executions. For a free trial to Kevin’s Daily Trading Report, please click here.
Commentary for 10/12/10
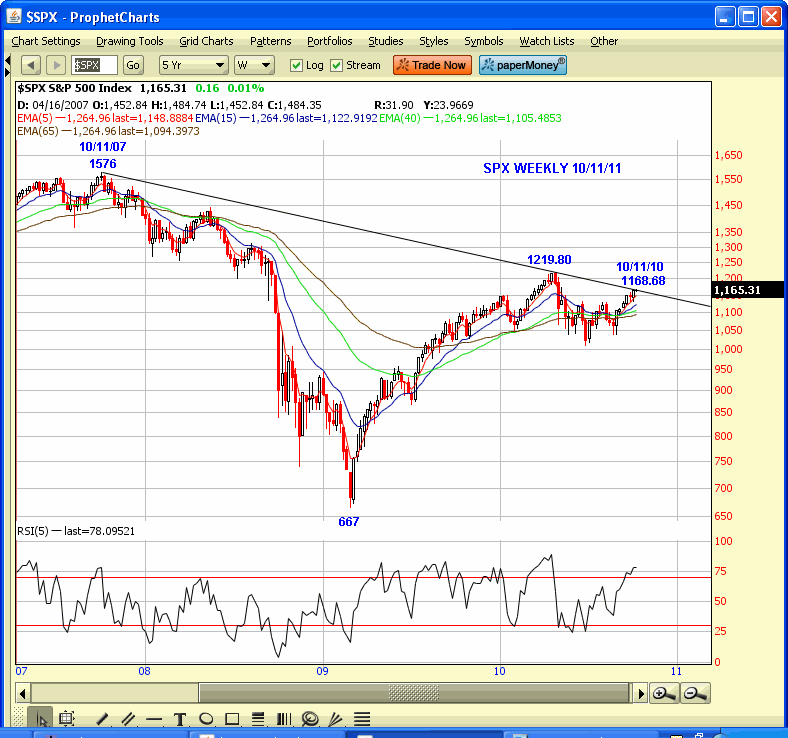
The SPX finished last week +1.6% to 1165.15, and based on yesterday’s 1168.68 intraday high it is +12.4% so far from the 8/27 1039.70 low, and the anticipated reversal zone from 8/27-8/30.
The rally has extended longer than I thought it would because the U.S. dollar has continued to decline as the Fed and other central banks have inflated asset prices because of the QE that started in July, and now the market has been anticipating another round of QE by the Fed, expected to be announced in early Nov, which just so happens to coincide with the mid-term elections.
The current rally has probably already priced in the next QE, and the expected loss of the House to the Republicans. However, it is very speculative right here in front of the mid-term elections to take a short position in front of the Fed and central banks as they continue to print money and inflate asset prices, especially commodities.
The jobs situation is worse than ever despite the spin by the biased empty suits on CNBC who very rarely give the other side or correct story about anything that is negative to the “gang” now running the country, as opposed to facts from people that have no ax to grind like John Williams from shadowstats.com and John Mauldin at Thoughts from the Frontline. It is very apparent that the big deficit spending, borrowing, taxing, and over regulation polices of the current administration are not solving the original problem, which is the derivative meltdown and housing crisis, in addition to the unemployment situation which is considerably more when you use the more valid U6 number which is about 18%.
The SPX broke above the 1140-1151 zone, which is certainly a technical positive, and that is now the key support. The 1/19 high was 1150.45 and 1140 is the .618RT to 1219.80 from the 1010.91 low, and 1158.60 is the .707RT zone. The SPX made a new high close at 1165.30 yesterday, and there has been a negative 5RSI divergence ever since the 9/20 1144.86 high. The 20DEMA is 1141.05, in addition to the 1140 .618RT, so that is probably the zone that will be in play on any near term reversal.
Bonds are at ridiculous levels and the next bubble waiting to burst, but the Fed will try to prolong it as long as possible because under Clinton the bond maturities were significantly shortened, and any significant break in the bond market means higher refinancing costs for the U.S. However, the Fed can’t control long term interest rates when capital flees the U.S. because of political and financial instability and that is what will most likely happen down the line.
Yesterdays 10/11/10 1168.68 rally high was right at the downtrend line from the 10/11/07 1576 high drawn through the 4/26 1219.80 high, so there is some anniversary symmetry in price, and there is also some minor Fib day count symmetry this week so any quick reversal would be no surprise.
Have a good trading day!

Click here to find full details on Kevin’s courses including Trading with the Generals with over 20 hours of professional market strategies. And for a free trial to Kevin’s daily trading service, click here.
Click here to sign up for a free, online presentation by Larry Connors, CEO and founder of TradingMarkets, as he introduces The Machine, the first and only financial software that allows traders and investors to design and build quantified portfolios.
