Fibonacci + Ichimoku Makes a Deadly Recipe for Resistance
Looking over the charts early this morning, there was a gestalt presenting itself across both the majors and many crosses as well. Any daily chart on the EUR/USD, GBP/USD, AUD/USD, to EUR/JPY or GBP/JPY would have produced an ironic synergy between Western and Eastern trading
systems.
If you were to pull a Fibonacci from the major swing high to low for any of the pairs mentioned above, you would have found the 50% fibonacci to announce itself as the culprit behind any rejection from these pairs. What is more interesting is that all of the above pairs
also had an Ichimoku Kijun line planted at almost perfectly the same levels.
Coincidences like this are rare and often lead to strong responses from the market, and that is exactly what we got. The Fib levels alone could have produced a nice rejection, but combine that with one of the last lines of defense for Ichimoku traders – the Kijun line (26EMA) and you have a high probability rally point to sell them.
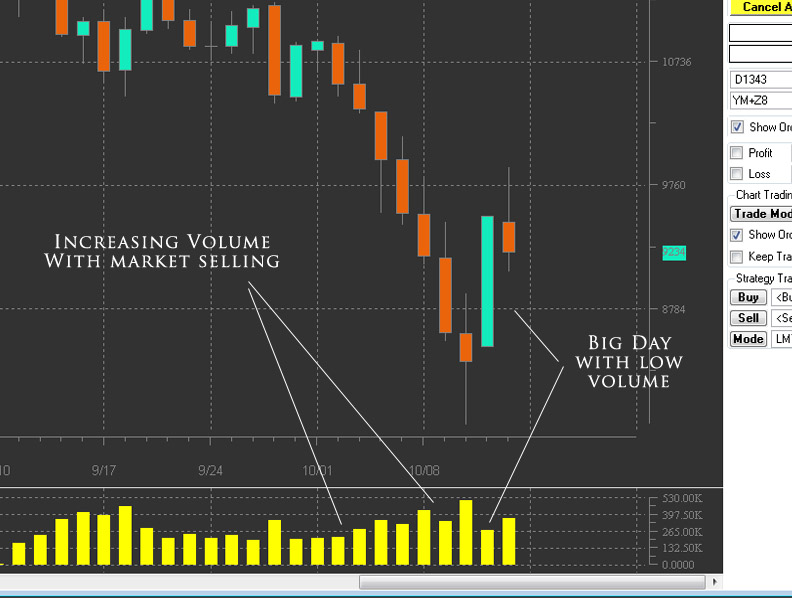
This trader is not really convinced the Dow’s historic and meteoric bounce Monday is going to produce a strong follow through. Taking a look at the chart below, notice how the volume is increasing during the parabolic sell off last week (which may invoke pain for several equities traders), but on the day of the explosive bounce, volume drops over 40%.
Figure 1: Dow Chart

This generally means the institutional money is not behind the actual move and the market is going to need a much more persuasive play before they get behind it. Most likely, the large money was not behind it with that kind of drop in volume further supports this theory. But notice the increase in volume as the markets sold off today suggesting the order flow was more behind this day’s price action the the previous ones.
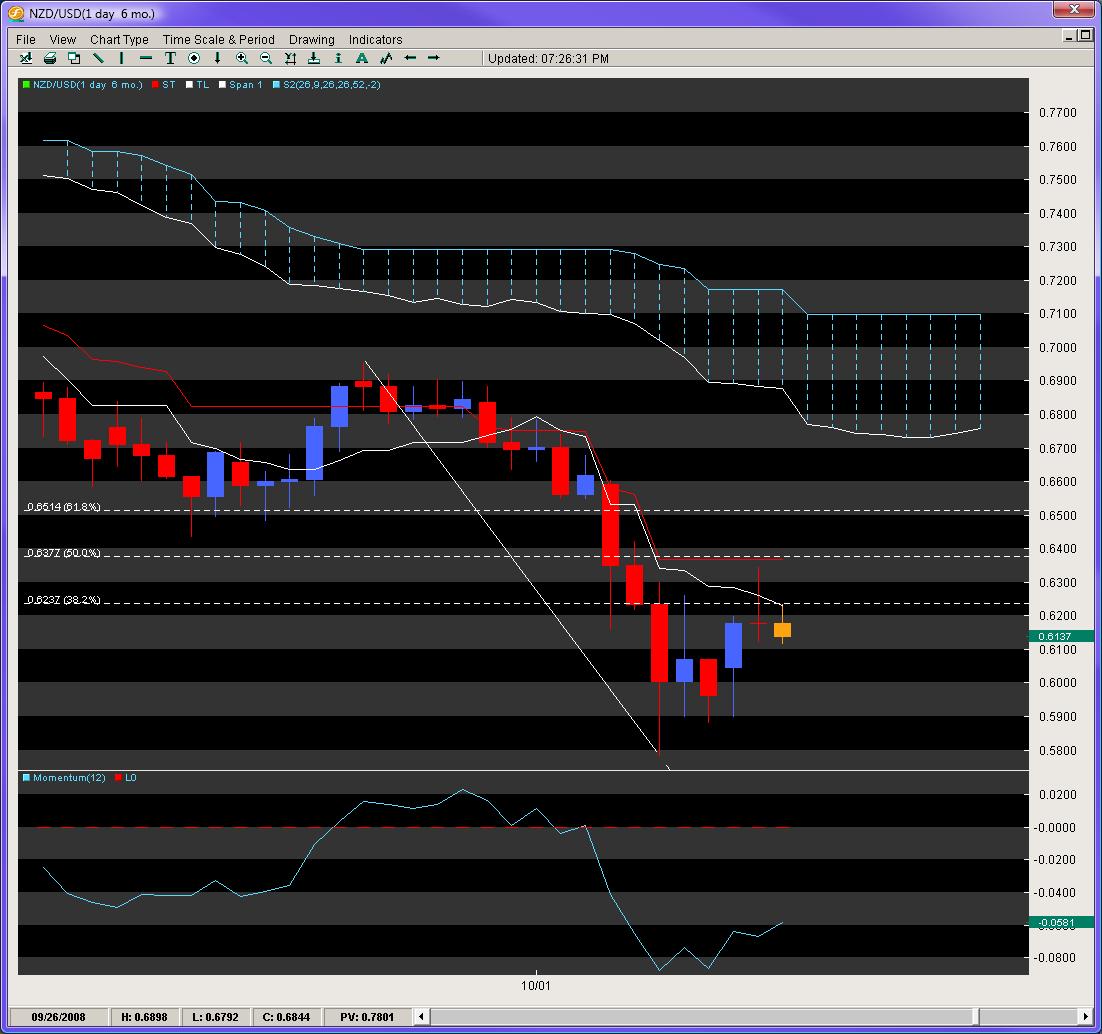
With such a theme in mind, taking a look at some of the aforementioned pairs, we notice how the momentum models are also not behind such bounces they have undertaken in the last few days. On all the pairs, price action reached either the 38.2 or 50 fib but momentum levels have not touched either fib, suggesting with the momentum model behind the price action, its not a healthy bounce as demonstrated by the chart below on the NZD/USD.
Figure 2: NZD/USD Daily Chart

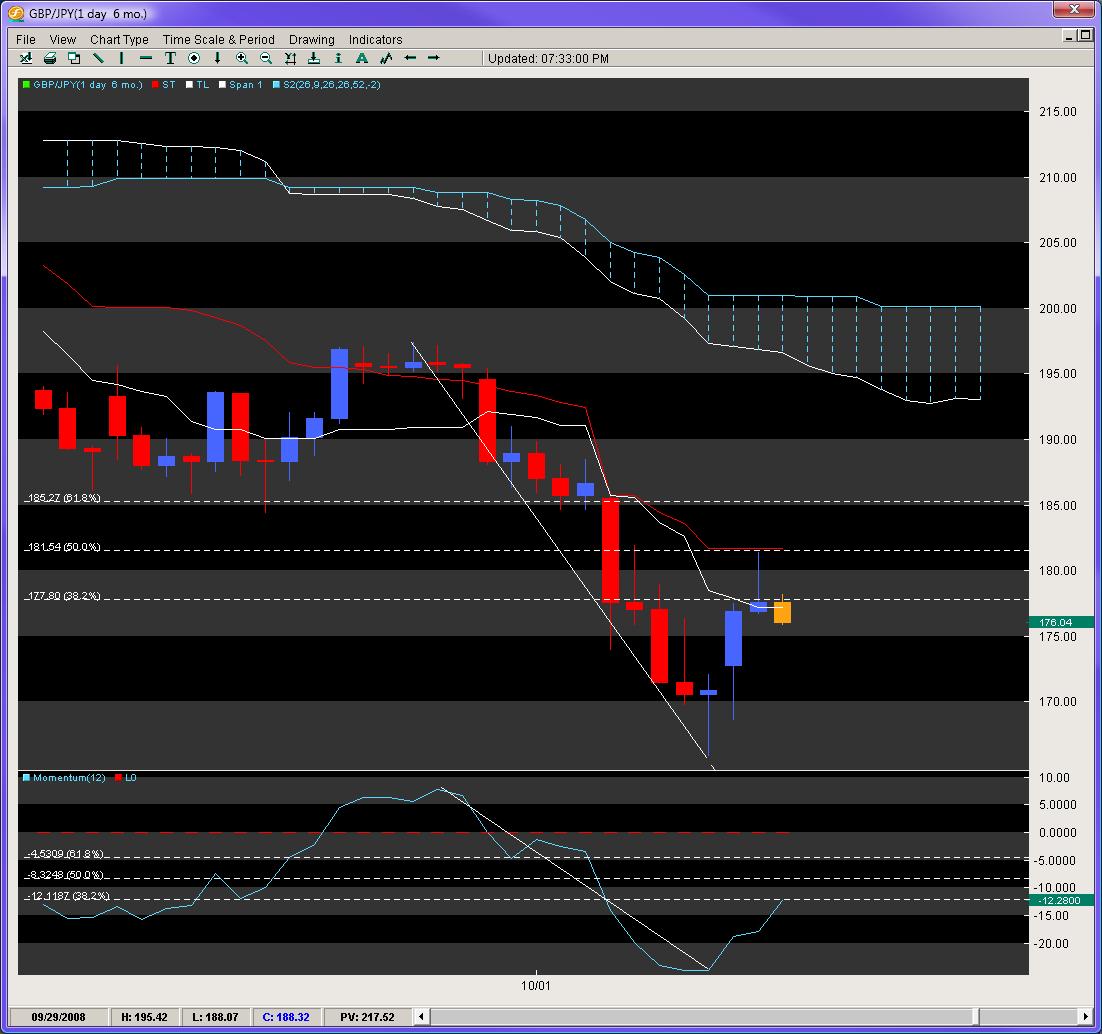
Looking at an entirely different animal – the GBP/JPY, we are also seeing such a model with the Kijun (red line) stepping up handsomely side by side with the 50 fib as if they were about to get married, which also offered a nice rejection today for the pair, sending it over 500 pips at the writing of this article (7.30pm PST).
Figure 3: GBP/JPY Daily Chart

To further illustrate this point of the bounce appearing more illusory in nature, notice how the momentum has yet to reach the 50% fib, but price has already touched it, suggesting it is ahead of the price action which is what we call an ‘unhealthy’ momentum model. These moves generally do not provide the internal mojo or order flow to carry them much further. We expect the 50 or 61.8 fibs to reject our hit list of pairs above, with prices starting another attack to the downside which is the line of least resistance.
Chris Capre is the Founder of Second Skies LLC which specializes in Trading Systems, Private Mentoring and Advisory services. He has worked for one of the largest retail brokers in the FX market (FXCM) and is now the Fund Manager for White Knight Investments (www.whiteknightfxi.com/index.html). For more information about his services or his company, visit www.2ndskies.com.
