Fibonacci Flares
Over the last
couple of weeks the indices have been playing around in key daily and weekly
price support zones. In fact, we were even getting pattern formations against
these zones and time cycles that were calling for a reversal to the upside.
However, each rally in the last couple of weeks ran right up to 60 minute chart
Fibonacci resistance and rolled back over. So, we have been keeping a sharp
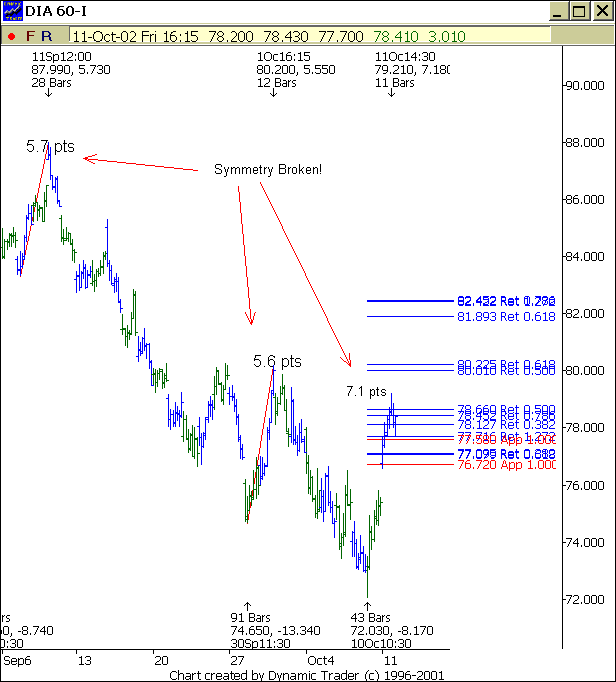
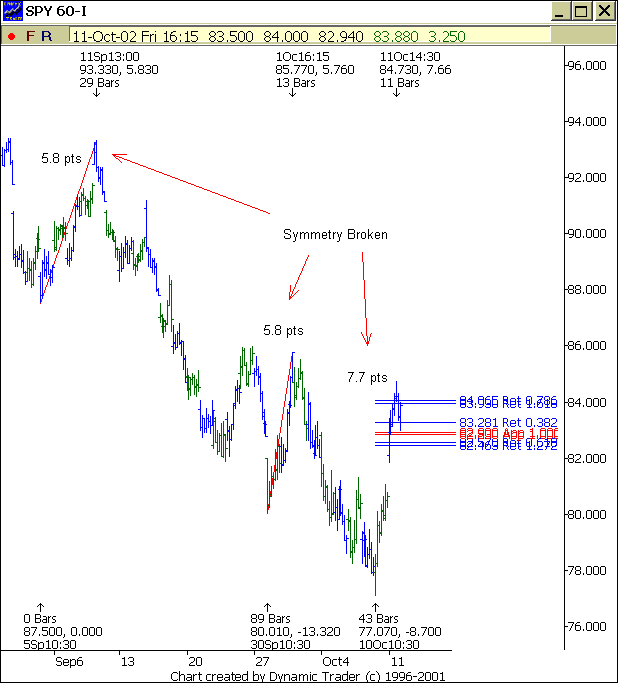
eye on these 60 minute charts of the indices. Below you will see that the rally
over the last two days (as of today) have broken through key Fibonacci price
resistance zones on this time frame and the symmetry of the corrective rallies
have now been broken. This is a warning flare with Fibonacci that the immediate
down trend is broken and that we could rally to the next level of resistance
which would be focused on the daily charts. Below are charts of (SPY) and (DIA)
on the 60 minute time frame to illustrate what I am describing.


I can not
tell you that we are now in a longer term rally mode the rest of the year, but
Fibonacci has at least shot off a warning flare to consider the possibilities.
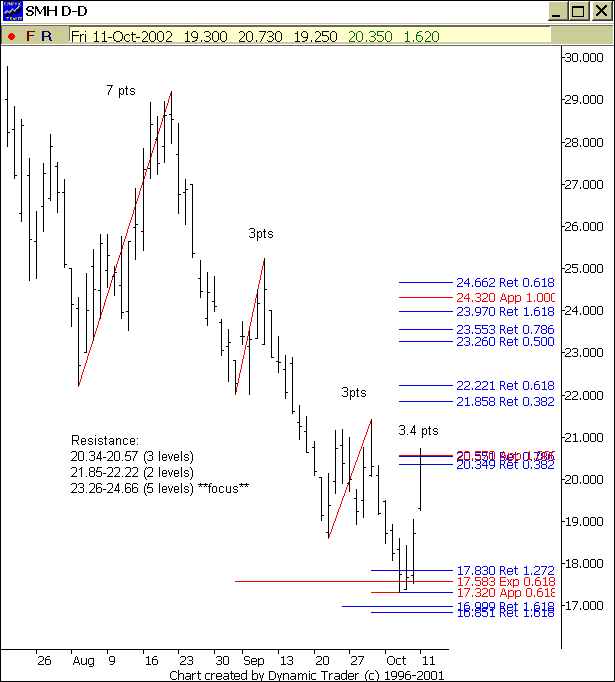
On another note: Review Monday’s column on Semiconductors. Below is the daily
chart. Basically this group hit our first Fibonacci support zone and reversed
nicely to the upside.

Good night!
