Filtering market signals from noise
In
a
recent post, I showed how the 11% of largest trades in the S&P emini futures
controlled essentially all of the market’s price action. While large trades of
100 contracts or more make up only about 3% of all trades executed in that
market, they account for well over half of all volume. Conversely, about half
of all executed trades are one- and two-lots, but they only account for several
percent of the market’s total volume. When you recognize that volume and
volatility are highly correlated, it isn’t difficult to figure out who controls
the marketplace.
Below is an unusual
Market Delta chart in that it tracks
the number of trades that are occurring at each 15-minute bar, and it is only
counting those trades that are 50 contracts in size and larger. When the bar is
green, we know that more large trades are occurring at the market’s offer
price. When the bar is red, those trades are predominantly transacted at the
bid. By limiting what we look at to trades of 50 contracts and higher, we gain
a level of transparency regarding the sentiment of large traders. When they’re
bullish, they will be willing to take the market’s offering price; when they’re
bearish, they will bail out at the bid.
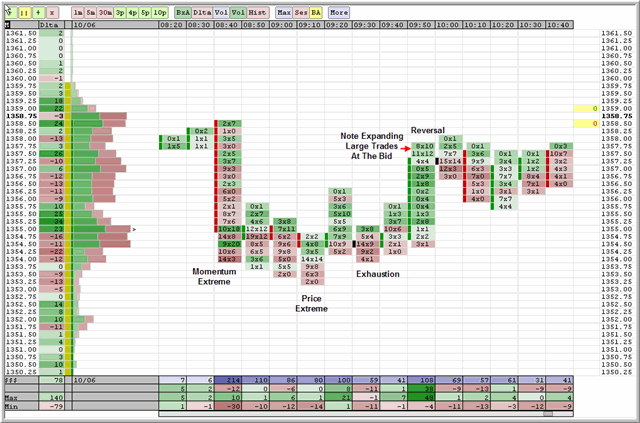
Tracking large trades over time also
allows us to see if the participants who move the marketplace are entering or
leaving the market. Notice, for example that the number of large trades
expanded as we moved higher during Friday’s trade at the 10:00 AM bar. Much of
this expanded participation was at the market bid as well as the offer: sellers
as well as buyers were attracted to the rise. Over the next three bars, the
participation of large traders declined and we could not make new price lows.
This invited selling and increased participation of large traders to the
downside (at the market bid).
Many technical indicators treat each
time unit and price change in the market as equivalent. But not all trades
and traders impact the market equally. Perhaps reducing the data we
look at could help us filter signal from noise.
Brett N. Steenbarger, Ph.D. is Associate Clinical
Professor of Psychiatry and Behavioral Sciences at SUNY Upstate Medical
University in Syracuse, NY and author of
The Psychology of Trading (Wiley, 2003). As Director of Trader
Development for Kingstree Trading, LLC in Chicago, he has mentored numerous
professional traders and coordinated a training program for traders. An active
trader of the stock indexes, Brett utilizes statistically-based pattern
recognition for intraday trading. Brett does not offer commercial services to
traders, but maintains an archive of articles and a trading blog at
www.brettsteenbarger.com and a
blog of market analytics at
www.traderfeed.blogspot.com. His book, Enhancing Trader Performance,
is due for publication this fall (Wiley).