First Hour Strategies Dominate Day Trading
Kevin Haggerty is a full-time
professional trader who was head of trading for Fidelity Capital Markets for
seven years. Would you like Kevin to alert you of opportunities in stocks, the
SPYs, QQQQs (and more) for the next day’s trading?
Click here for a free one-week trial to Kevin Haggerty’s Professional
Trading Service or call 888-484-8220 ext. 1.
The SPX was down 3 straight days into Monday’s
1418.46 low, from 1440.69 last Friday, and then the generals’ anticipated
mark-up began into month-end and the first few days of February, new money.
In the 1/29 commentary, I said I expected the SPX to close higher this week than
last, and after yesterday’s SPX 1445.92 (+0.5%) close, that is a lock. The
mark-up was made easier with the FOMC pollyanna statement about economy, rates,
etc. Let me see, the world changed dramatically in just 4 weeks from the
last statement? Go read it. It just takes a sharper pencil, and the always
changing government assumptions that always seem to fit the occasion when they
need it, not to mention the President’s 11 AM speech on Thursday and visit to
the NYSE floor. This followed the Treasury Secretary’s (Henry Paulson) 10
AM speech on the economy and exchange rates. Some of the things Paulson
comes out with makes him sound like a socialist in capitalism clothing, so he
will fit in well with Hillary Clinton and Nancy Pelosi if they win in 2008.
NYSE volume was 1.69 billion shares yesterday,
with the volume ratio 77 and breadth +1570. The 4 MA’s are now short-term
over-bought (SB-OB), with the volume ratio 67 and and breadth +1186. With
the SPX and $INDU at new bull-cycle highs, the significant market action for the
Dow Theory crowd will be if the $TRAN can take out and hold the 5014 5/10/06
high. It hit 5000 yesterday, and closed at 4998.75. The bulls will
probably make that happen today. Daytraders caught SPX RST long entries at
10 AM on Wednesday, and then RST shorts yesterday, except that the contra-move
was small, and the SPX went sideways from the 9:55 AM bar 1444.07 high, to the
2:50 PM bar where it ticked to 1446.64, before closing at 1445.92. The
QQQQ RST short on the 10 AM bar made a +1% from entry to cover at the 480 ema
(5-min chart). The early decline in the energy stocks set daytraders up
with some -1.0 Volatility Band (VB) trades at the 240, 480 and 860 dema’s, so it
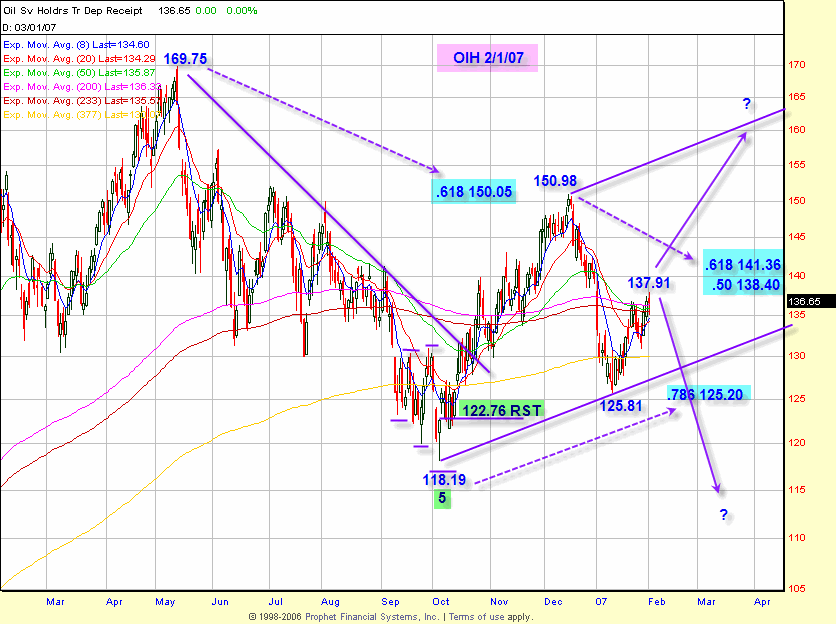
was a very productive 1st hour of trading. The OIH is +9.6% (low to high)
in 14 days from the 1/11/07 125.81 low. This preceded the crude oil move,
as the USO is +15.1% in just 10 days since January 18th. The OIH was at
anticipated key price levels relative to the 118.19 low from the 169.75 cycle
high. The 118.19 low was an important RST setup as was, 125.81, so the
trading service members have caught these energy moves. The OIH chart is
included, which highlights the RST, and just some of the key symmetry. If
it reverses 125.81, then parallel-line symmetry comes into play, starting with
the leg from 150.98 to 125.81.
Many of our primary focus stocks are extended
from 3 to 5 days into this markup, so traders should back off the long side and
take advantage of extended intraday VB shorts. Most all of the good energy
daytrades both ways have been from VB reversals, so that remains the same.
The techs have died, and some of our focus retail stocks, like JCP, JWN, AEOS,
and TGT started off February with retail up-bias, with strong percentage gains
yesterday relative to the SPX. With so many “players” in the “game” now,
the time horizons of these bias moves is much shorter, as you saw with the
semiconductors the first 2 weeks in January. The SPX is up 3 straight
days, and if “they” push the indexes higher today, take advantage of any
intraday SPX/ $INDU short setups.
Have a good trading
day,
Kevin Haggerty
Check out Kevin’s
strategies and more in the
1st Hour Reversals Module,
Sequence Trading Module,
Trading With The Generals 2004 and the
1-2-3 Trading Module.

