Flexible
The
1305-1307 resistance area put a thumb in the dike short
term, as the S&P 500
(
SPX |
Quote |
Chart |
News |
PowerRating) had a wide-range-bar down following Tuesday’s
narrow-range day on significant volume, which often precedes a change in the
immediate trend. The SPX high close was Monday at 1312.83, followed by Tuesday
at 1309.38.
There is no mystery if we
get a quick turn and continuation to the upside. The high is 1315.93. The
200-day EMA is 1305. On the down side, you come first to the trading range upper
boundary at 1272 and the 20-day EMA at 1262. The real magnet, however, is the
1200 level where you have the gap and it is also the .50 retracement level.
The SPX has advanced 21.7%
from the 1081 low to the 1316 high in 43 days, and bumped up and through the
200-day EMA for the first time since 11/6/00. There have been 100%+ moves in
many of the Semis, Biotechs, Travel Range stocks — and yes, even some of the
Basics have advanced 80%-100%, so a retracement of sorts certainly won’t be a
surprise. The extent of it will tell us how anxious the Generals are to get it
on and continue to discount future prospects.
We’re now looking at the
earnings-warning-hype circus which will highlight the very negative comparisons
this quarter. This is all well known to the Generals that are looking across the
valley, but when it’s announced, they stop buying and stocks have air pockets as the
market makers grease the skid for retail and the married puts attack some of the
volatile stocks — not to mention the programs which accelerate the market in
the direction it’s going. The
extended Semis are a good example of this. Yesterday, the Equipment makers took
the brunt of the decline when it was announced that orders for chip-related
group equipment and materials declined 40% in April compared to March.Â
I have included a
five-minute chart of the Nasdaq 100 Futures
(
ND1M |
Quote |
Chart |
News |
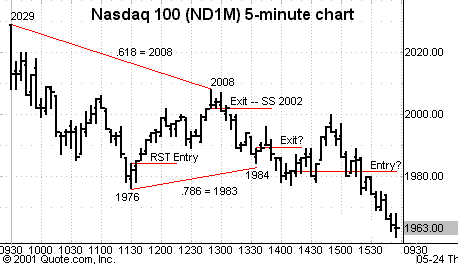
PowerRating) to point out two defined
opportunities. The first is an RST buy entry off the 1976 low setup bar. FYI,
the RST is only taught at my seminar but I put it in today so that those who
have attended can count backwards and see if they are on the money. There was a
good Trap Door entry on Kings and Queens prior to the RST entry, which failed
after a brief rally.Â
The RST trade ran to 2008
and hit the wall at the .618 level which was at the number, 2008, and that gave
you a very good short entry. From there, it traded down to the .786 level for a
good short trade cover and also to go long because the run to 2008 had broken
the down trendline and it looked like a 1,2,3 Higher Bottom was in
progress.Â
That was not to be, as it
rallied but two bars before making a Double Bottom, if you had entered above
the high of that Double Bottom setup bar which was 1982, it ran to 2000 before
failing and then proceeded to make new intraday lows into the close at 1960
after breaking the Double Bottom at 1976.Â

Five-minute
chart of yesterday’s Nasdaq 100 June Futures (ND1M)
This example is to point
out the sequence of trading decisions you make on these volatile days and the
importance of managing a trade and to also take them when you see a defined
pattern. It wouldn’t be called “trading” unless you had winners and
losers. If you’re trading futures, I doubt you would have had much time for
stocks — or even to go to the restroom, for that matter.
Stocks
Today
|
(June
|
||
|
Fair Value
|
Buy
|
Sell
|
|
2.45
|
2.75 |
1.25
|
Short setups on the daily charts:
(
CMVT |
Quote |
Chart |
News |
PowerRating),
(
CHKP |
Quote |
Chart |
News |
PowerRating),
(
GENZ |
Quote |
Chart |
News |
PowerRating),
(
PDLI |
Quote |
Chart |
News |
PowerRating), and
(
VSTR |
Quote |
Chart |
News |
PowerRating). Also in the
Semis,
(
NVLS |
Quote |
Chart |
News |
PowerRating) and
(
KLAC |
Quote |
Chart |
News |
PowerRating) have had two wide-range bars down the last
two days so on any kind of pullback to at least 50% of their last two daily
bars, you might look for setups in the five-minute charts and only second entry
shorts if there’s continuation.
On the long side, nothing
really sets up on the daily charts. Only two NDX 100 stocks finished in the top
25% of the range, so today look for intraday setups on strong stocks that have
pulled back to the top of their breakout ranges, especially those right at the
200-EMA.Â
A few stocks that did set
up on the daily charts:
(
HIG |
Quote |
Chart |
News |
PowerRating),
(
WPI |
Quote |
Chart |
News |
PowerRating),
(
FNM |
Quote |
Chart |
News |
PowerRating) and
(
FITB |
Quote |
Chart |
News |
PowerRating). If they
sell the Travel Range stocks early or overdo the Semis, then you are looking for
Trap Doors.
Have a good trading day.

Five-minute chart of yesterday’s S&P 500 (SPX) with 8-,
20-, 60-
and 260-EMAs

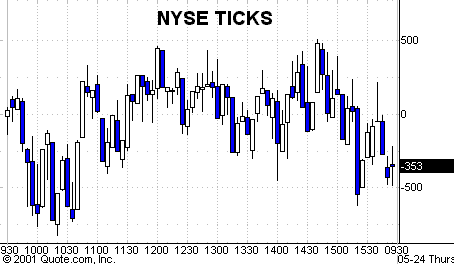
Five-minute chart of yesterday’s NYSE Ticks
