Focus Levels For The Nasdaq, QQQ And SPX
What Thursday’s Action Told
You
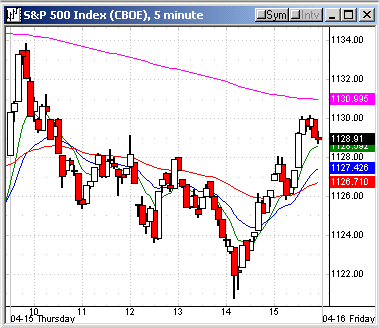
The opening move up ended on the 9:50 AM bar for
the major indices and
that proved to be the intraday high. The Generals were scrambling again yesterday as the SMHs were -3.3% on 80% more than its average volume while money continued to be
put to work in defensive issues like JNJ, +3.6%, MRK, +3.4%, with the PPH
also +3.4%. The OIH was +2%. The utilities took a rest as the XLU (utilities
SPDR) was +0.6% and the XLI (industrial SPDR) +0.3%. The TLT, -0.6%, declined
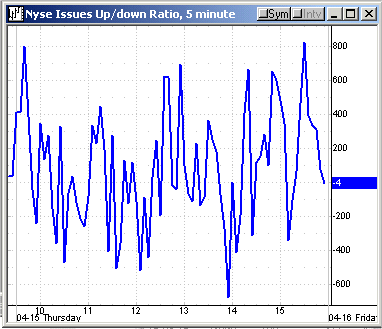
again for the sixth day in succession. NYSE volume was 1.56 billion with the
volume ratio neutral at 50 with the 4 MA at 37. Breadth was -100 as many of the
financials and related were soft red yesterday after the persistent selling the
last few days. The SPX and Dow finished small green with the SPX at 1128.84 and
Dow 10397. The SPX has closed within 1.5 points for the past three days between
1129.42 – 1128.17. In addition to the SMH at -3.3%, the Nasdaq closed at 2002,
back to what is now minor support but made an intraday low of 1989.21
before closing at 2002.
The Nasdaq did trade between 2004 – 2000 from
12:10 PM to 1:50 PM. After that 1989 low, it traded up to 2008 by 3:25 PM and
closed at 2002, -1.1% on the day. The QQQs were -1.8%, hitting an intraday low
of 36.02, closing at 36.15. All of the index proxies traded above their average
volume.
| Â | Fri. 4/9 |
Mon. 4/12 |
Tues. 4/13 |
Wed. 4/14 |
Thur. 4/15 |
Index |
|||||
| SPX |
|||||
High |
H | 1147.29 | 1147.81 | 1132.52 | 1134.08 |
Low |
1139.32 | 1127.70 | 1122.15 | 1120.75 | |
Close |
O | 1144.94 | 1129.42 | 1128.17 | 1128.84 |
% |
+0.5 | -1.4 | -0.1 | +.06 | |
Range |
L | 8 | 20.19 | 10.4 | 13.3 |
% Range |
70 | 9 | 58 | 61 | |
INDU |
I | 10514 | 10381 | 10378 | 10397 |
% |
+0.7 | -1.3 | -.03 | +0.2 | |
Nasdaq |
D | 2063 | 2030 | 2025 | 2002 |
% |
+0.5 | -1.7 | -0.3 | -1.1 | |
| QQQ |
A | 37.17 | 36.63 | 36.81 | 36.15 |
% |
+0.6 | -1.4 | +0.5 | -1.8 | |
NYSE |
Y | ||||
T. VOL |
1.10 | 1.42 | 1.55 | 1.56 | |
U. VOL |
610 | 153 | 470 | 772 | |
D. VOL |
482 | 1.26 | 1.04 | 785 | |
VR |
56 | 11 | 31 | 50 | |
4 MA |
42 | 36 | 35 | 37 | |
5 RSI |
67 | 40 | 38 | 40 | |
ADV |
1669 | 419 | 749 | 1610 | |
DEC |
1621 | 2954 | 2626 | 1710 | |
A-D |
+48 | -2535 | -1877 | -100 | |
4 MA |
-447 | -850 | -1301 | -1116 | |
SECTORS |
|||||
SMH |
+0.6 | -1.2 | -0.8 | -3.3 | |
| BKX |
+0.6 | -2.2 | -1.4 | -0.9 | |
XBD |
+0.6 | -2.8 | -1.1 | -0.3 | |
RTH |
+0.7 | -1.6 | +0.3 | +0.4 | |
CYC |
+0.7 | -2.0 | -.05 | +0.4 | |
PPH |
+.08 | -0.8 | +1.5 | +3.4 | |
OIH |
+2.3 | -1.7 | -0.4 | +2.0 | |
| BBH |
-0.3 | -1.6 | +0.4 | +0.7 | |
TLT |
-0.4 | -1.1 | -.08 | -0.6 | |
| XAU |
+0.1 | -6.1 | -1.7 | +1.2 |
For Active Traders
In yesterday’s commentary we mentioned using the
QQQ 240 and 480 EMAs at 36.81 as an early guideline. The QQQ traded to 36.86
yesterday on the 9:50 AM bar, then reversed 36.81 to the downside, trading to
the 36.02 intraday low. The SPX and Dow both reversed on the 9:50 AM bar as the
SPY made an RST sell pattern. The SPY traded down to a 112.36 intraday low while
the SPX hit its 1120.75 low vs the 1.0 volatility band of 1119.49. This low set
up an RST buy pattern with entry above 112.66. This wasn’t a Moonshot, but it
did run to 113.38 before closing at 112.96. The
RST is an expanding volatility pattern and the erratic price action on good
news/bad news is what you want.
For Today
It’s expiration Friday and much of the agenda has
been in progress, but there should still be some activity today which might give
get traders some travel range to work with. Some early lines to focus on are the
Nasdaq 2000 level and for the QQQ the 36.32 – 36 zone which are the 20, 50, and
89 day EMAs along with the 36 minor support. The SPX closed at 1128.84 with the
20-day EMA at 1130.72 and the 50-day EMA at 1127.46 as an early downside line.
A few more air pockets by the major indices and
some
1,2,3 lower top trend entries (weekly chart) are in play, such as 34 on the
QQQ. Keep in mind that in spite of the previous retracement to 34, that was only
a .236 retracement to the 1976 10/02 low so there is definitely more room to
reach the 32.50 -31.50 zone if there is downside acceleration. The next intraday
RST buy pattern on the QQQ sets up below yesterday’s 36.02 low. For the SMH, it
is below 38.87 and the SPY, below 112.36, which means below 1119 on the ESM4.
Have a good trading day,
Kevin Haggerty


Â
