For A Further Advance, Here’s What’s Needed
Stock index
futures were able to finish slightly higher last week, thanks to a number of
solid reports on the earnings and economic fronts. For the most part, just
about every economic data point was quite strong and suggested the economic
recovery could be growing legs. In addition, Cisco Systems reported a robust
quarter, which helped technology shares outperform for the week. While the news
flow was positive, it may have a bit disturbing to the bulls that the key
indexes were not able to capitalize much overall. In fact, the trend of “sell
the good news” continued to unfold, suggesting that much of the recent strong
data may have already been priced into stocks. Nevertheless, the mere fact that
the news remains upbeat has kept market players optimistic for higher prices
down the road.
The December S&P 500
futures closed Friday’s session with a loss of -8.00 points, but
still managed to squeak out a 1 point gain for the week. The December Dow
futures closed Friday’s session with a 70 point loss, but still tacked on 10
points for the week. Volume in the ES and YM were estimated at 614,000 and
54,000contracts respectively, which was in line with Thursday’s pace and above
the daily average. Open interest behaved itself, indicating that the aggressive
shorts still haven’t really stepped up to the plate. On a weekly basis, the ES
stalled and closed just below that heavy Fib resistance zone we’ve been tracking
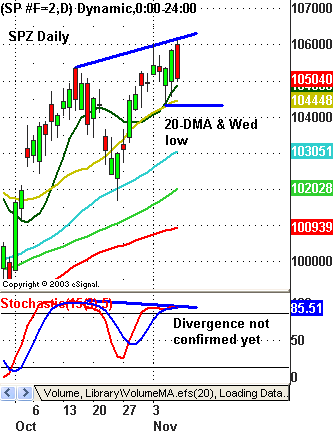
for a few weeks. On a daily basis, the ES posted a bearish “dark cloud cover,”
and settled just above its 10-day MA (see chart). A close below the 20-day MA
and last Wednesday’s low in the 1,044-43 area would confirm that a short-term
top has been posted. On an intraday basis, the 13-min chart is forming a
bullish Gartley pattern with a reversal point in the 1,048.75 area.

Looking
ahead, we’re
entering a part of the year where there is little news flow to provide catalysts
for market players. Also, it’s often regarded as the most favorable seasonal
period for owning stocks in the entire year. Without question, upside momentum
has really stalled in the equity and equity futures markets in recent weeks,
despite an economic news backdrop that has pretty much been nothing short of
sensational. Keep in mind, contrary thinking usually suggests that one should
be selling and acting more cautious when the news is great and higher prices
look like a given, just as one should be buying when all looks lost. At the
moment, the current situation appears to be one those circumstances where most
market players simply feel they can buy stocks and making money will come easy.
It’s even been mentioned by market pundits that stocks can be bought ahead of
the election next year and not worry. This general sense of optimism combined
with how lackluster stocks have acted in the face of good news can be a warning
signal. Make no mistake, right now market internals are still decent, interest
rates are still low, and most data still suggest decent economic conditions for
the next 2 quarters, but a shakeout may be needed before stocks are able to
stage much more of an advance. In addition, there are also lingering
longer-term issues, such as overall high debt levels, an unstable U.S. dollar,
and the possibility of higher interest rates, which could come into play.
The
economic calendar is pretty anemic this week, with the only real action on
Friday with the Producer Price Index, Retail Sales, and Michigan Consumer
Sentiment Index. Trading will most likely be quiet ahead of Tuesday’s Veteran’s
Day and bond market holiday.
Daily Pivots for 11-10-03
| Symbol | Pivot | R1 | R2 | R3 | S1 | S2 | S3 |
| COMP | 1977.27 | 1985.74 | 2000.73 | 2009.20 | 1962.28 | 1953.81 | 1938.82 |
| INDU | 9837.32 | 9876.04 | 9942.28 | 9981.00 | 9771.08 | 9732.36 | 9666.12 |
| NDX | 1442.11 | 1448.08 | 1459.44 | 1465.41 | 1430.75 | 1424.78 | 1413.42 |
| SPX | 1055.92 | 1059.68 | 1066.14 | 1069.90 | 1049.46 | 1045.70 | 1039.24 |
| ESZ | 1055.00 | 1060.00 | 1069.50 | 1074.50 | 1045.50 | 1040.50 | 1031.00 |
| SPZ | 1053.90 | 1057.80 | 1065.20 | 1069.10 | 1046.50 | 1042.60 | 1035.20 |
| NDZ | 1440.17 | 1448.33 | 1463.17 | 1471.33 | 1425.33 | 1417.17 | 1402.33 |
| NQZ | 1441.33 | 1450.67 | 1467.83 | 1477.17 | 1424.17 | 1414.83 | 1397.67 |
| YMZ | 9814.33 | 9873.67 | 9974.33 | 10033.67 | 9713.67 | 9654.33 | 9553.67 |
| BKX | 950.40 | 954.08 | 961.00 | 964.68 | 943.48 | 939.80 | 932.88 |
| SOX | 527.77 | 530.82 | 535.21 | 538.26 | 523.38 | 520.33 | 515.94 |
| DIA | 98.52 | 98.94 | 99.76 | 100.18 | 97.70 | 97.28 | 96.46 |
| QQQ | 35.80 | 36.01 | 36.38 | 36.59 | 35.43 | 35.22 | 34.85 |
| SPY | 105.97 | 106.36 | 107.12 | 107.51 | 105.21 | 104.82 | 104.06 |
| SMH | 44.21 | 44.48 | 44.97 | 45.24 | 43.72 | 43.45 | 42.96 |
Fair Value & Program Levels
Fair Value — (1.02)
Buy Premium — (0.40)
Sell Discount — (2.32)
Closing Premium – (2.81)
Please feel free to email me with any questions
you might have, and have a great trading day on Monday!
