For aggressive traders only, focus here
Every so often there comes a year
when understanding the big picture globally becomes especially critical to your
investment success and even profitability. 1998 was such a year. Those who did
not understand the macro big picture got sideswiped by the huge impact of the
Asian currency crisis. Traders focused solely on the micro analysis of their
various technical systems felt like a hurricane from out of the blue had hit
them unawares, from day trader to intermediate-term swing trader, as shock-waves
overwhelmed all other forces. Long-term investors also faced a tsunami as
fundamentals went out the window and babies were thrown out with the bath-water
in a true global panic. There are times when understanding the big macro picture
and what can throw it out of whack and into shock are crucial to profiting from
a year and essential to avoiding a major shock to your portfolio. I believe 2006
could well be another year where understanding the macro picture and its
increasingly explosive vulnerabilities could be paramount to your investments.
I felt it was so critical for investors to understand the big-picture macro
potential top and global bear market in stocks developing in the late 1990’s
that in 1998 I wrote my book The Hedge Fund Edge, that described what was
happening and how stocks would ultimately be hard-hit, and how investors could
avoid much of the pain. I also felt this was the case just after the 2000 peak
in the market, when, at the TradingMarkets conference in Las Vegas in 2001, I
told investors I felt that tech and internet stocks in particular had made a
“generational peak.†It is interesting how increasingly frequent these big
picture macro shock-waves have become, and how much more important an
understanding of the force behind them now is.
I wish I could go on to explain the precarious situation of the global financial
markets in this column, but unfortunately this column is far too short for me to
be able to impart to you the true story in a way that could be understandable.
It is for this very reason that I have just completed and updated the “2006
Investment Roadmap.†See the end my article for details on how to obtain it.
I can remember very vividly two times when beautiful short-term trading
methodologies I was using were overwhelmed by major shock-waves that negatively
impacted my trading in ways that could have been avoided and substantially more
profits garnered if I had only understood the big-picture background at the time
completely. The first was 1981, when I had slowly and meticulously built a short
pyramid in OJ futures and they had begun to plummet beautifully. Don’t forget
this Rule: Never short OJ in the winter, and never do so without understanding
the weather situation and the potential for problems. One Friday in January a
major breakdown looked underway. And then there was a FREEZE over the weekend.
Limit up for over a week. Riches to barely affording UC Berkeley in about two
weeks.
The second time was 1987, and in many ways it was even more frustrating. I
understood the forces that were leading to that panic and had built a nice short
position in Eurodollar futures, along with those forces. I was out of stocks
watching and waiting. But what I failed to understand was how major shocks can
impact virtually every market and invoke unanticipated responses from the powers
that be. The response to the October market crash was NOT INITIALLY a run to the
quality of bonds BY THE MARKETS THEMSELVES. However in thin Asian trading,
massive volume bond and Eurodollar purchases by the Fed helped trigger a
“perceived†flight to bonds that led to a gap up in Eurodollars beyond the last
several months of market decline Monday morning. My position was smaller and the
impact merely to erase most of a profit, but the frustration was even greater in
many ways because I felt I was on top of the situation more thoroughly.
My point is that when real and major shock-waves triggered by big picture huge
macro forces hit, I don’t think there’s a trader in the world who doesn’t
benefit by having understood the precarious nature of the big picture
vulnerabilities before-hand, as well as what the reaction of the authorities to
such panic are likely to be. Because of knowing this, I did much better in 1998
and in 2000.
We live in interesting times. Ones that I believe more than ever REQUIRE a full
understanding of the big picture macro environment and its vulnerabilities. The
most massive fiscal and monetary stimulus since Hitler has been injected into
Japan, a major economy with global implications. The most massive CONCERTED
GLOBAL central bank stimulus program since WWII is winding down. In my opinion,
there has never been a time in my life when understanding the macro situation
has been more critical than in the period of the next few years ahead.
And so I have spent much time and analysis in trying to explain our global
predicament to investors and traders in the “2006 Investment Roadmap.†For full
details on how to receive it, see the information at the end of this article.
I will continue to do my best to help investors through potential storms with
this column, but without a thorough understanding of what is happening and why,
something I just can’t cover in this amount of space, I cannot do justice to the
critical nature of the macro environment.
In this regard the Wall of Worry continues to be climbed by global markets this
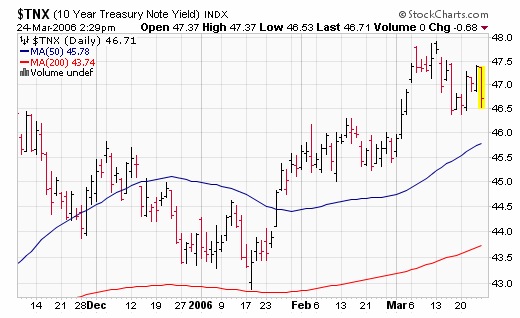
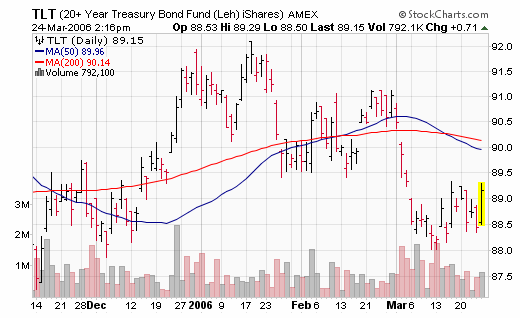
week. Bonds are still staying precariously close to the critical 4.9% yield that
will BEGIN to trigger problems for global stocks should they be breached. The
EUR and Yen continue to oscillate in ranges, with big implications upon an
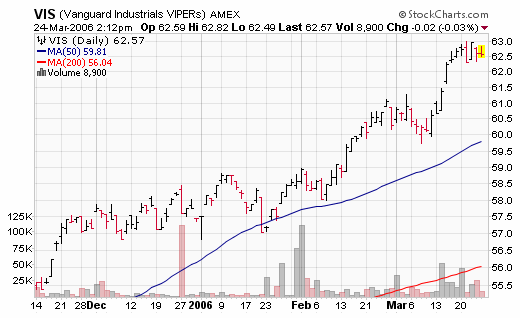
ultimate breakout. We continue to like industrials, healthcare, networks,
(bottom in natural gas stocks and trusts here?), China, Indonesia, Telecoms, and
Aerospace on the long side and (we suggest some hedging here for those with
close to normal exposure) we like on the short-side big cap internets and
General Merchandise, as well as some interest-rate sensitive, and big-cap
growth. Aggressive traders could position with strong groups over weak ones, but
with more cautious allocation than normal.
Our model portfolio followed in TradingMarkets.com with specific entry/exit/ops
levels from 1999 through May of 2003 was up 41% in 1999, 82% in 2000, 16.5% in
2001, 7.58% in 2002, and we stopped specific recommendations up around 5% in May
2003 (strict following of our US only methodologies should have had portfolios
up 17% for the year 2003) — all on worst drawdown of under 7%. This did not
include our foreign stock recommendations that had spectacular performance in
2003.
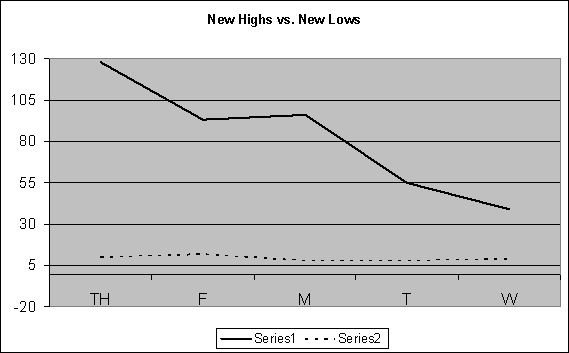
Meanwhile in our US selection methods, our Top RS/EPS New Highs list published
on TradingMarkets.com, had readings of 128, 93, 96, 55 and 39 with 23 breakouts
of 4+ week ranges, no new trades and
(
PVA |
Quote |
Chart |
News |
PowerRating) ,
(
RTI |
Quote |
Chart |
News |
PowerRating) &
(
AIR |
Quote |
Chart |
News |
PowerRating) close
calls. This week, our bottom RS/EPS New Lows recorded readings of 10, 12, 8, 8
and 9 with 6 breakdowns of 4+ week ranges, no valid trades and no close calls.
The “model†portfolio of trades meeting criteria is now long
(
GG |
Quote |
Chart |
News |
PowerRating),
(
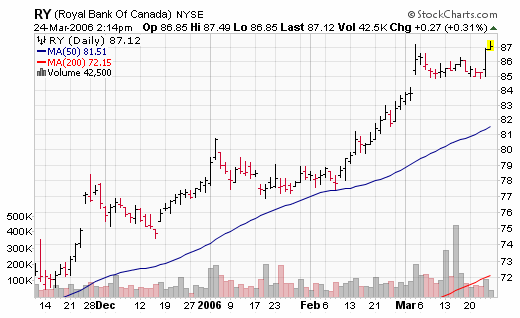
RY |
Quote |
Chart |
News |
PowerRating)
(raise stop on new high),
(
AXA |
Quote |
Chart |
News |
PowerRating),
(
TS |
Quote |
Chart |
News |
PowerRating), and
(
MTU |
Quote |
Chart |
News |
PowerRating) (last month’s lows
must hold). Continue to tighten up trailing stops whenever possible on stocks
with open profits and strive to move stops to break-even or better as quickly as
possible in new entrants.
Mark Boucher has been ranked #1 by
Nelson’s World’s Best Money Managers for his 5-year compounded annual rate of
return of 26.6%.
For those not familiar with our
long/short strategies, we suggest you review my book
The
Hedge Fund Edge, my course “The
Science of Trading,” my video seminar, where I discuss many new techniques,
and my latest educational product, the
interactive training module. Basically, we have rigorous criteria for
potential long stocks that we call “up-fuel,” as well as rigorous criteria for
potential short stocks that we call “down-fuel.” Each day we review the list of
new highs on our “Top RS and EPS New High List” published on TradingMarkets.com
for breakouts of four-week or longer flags, or of valid cup-and-handles of more
than four weeks. Buy trades are taken only on valid breakouts of stocks that
also meet our up-fuel criteria. Shorts are similarly taken only in stocks
meeting our down-fuel criteria that have valid breakdowns of four-plus-week
flags or cup and handles on the downside. In the U.S. market, continue to only
buy or short stocks in leading or lagging industries according to our group and
sub-group new high and low lists. We continue to buy new long signals and sell
short new short signals until our portfolio is 100% long and 100% short (less
aggressive investors stop at 50% long and 50% short). In early March of 2000, we
took half-profits on nearly all positions and lightened up considerably as a sea
of change in the new-economy/old-economy theme appeared to be upon us. We’ve
been effectively defensive ever since, and did not get to a fully allocated long
exposure even during the 2003 rally.
