Forex Support and Resistance: The Key Levels to Focus On
Mark Whistler is the founder of www.WallStreetRockStar.com and is the author of multiple books on trading. Mark’s newest book, The Swing Trader’s Bible – co-authored with CNBC/Fox News regular guest Matt McCall – will be on shelves in late summer, 2008. In addition, Mark also writes regularly for TraderDaily.com and Investopedia.com.
1. EUR/USD Attempting to Break Highs
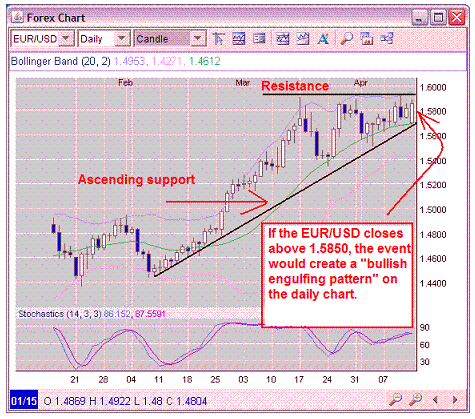
The Euro’s huge gap-down open on Sunday evening – and then recovery on Monday – could be the coupe de grace the currency needs to post fresh highs. At least it would appear that way on the daily chart, so long as the EUR/USD closes at 1.5850, or better.
The gap down in the Euro – and rally – is creating what’s known in candlestick charting as a “bullish engulfing pattern” and is an upside favorite of many technicians. Overhead resistance sits at 1.5910, which if breached, could trigger a capitulatory move upward in the euro and fresh lows in the U.S. dollar.

2. USD/CAD About to Move
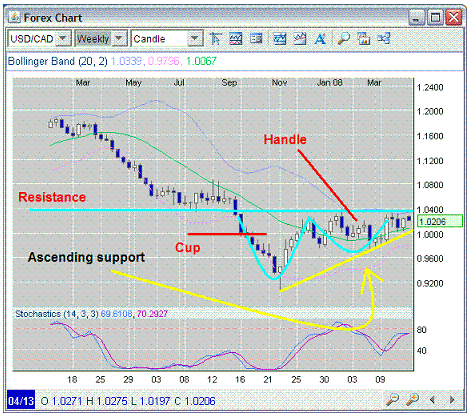
Looking at the weekly chart of the USD/CAD below, we see that the pair have been consolidating for the past five and a half months, and are now approaching a critical point, potentially alluding to a large move in the coming weeks.
What you will first notice on the chart, is the “cup and handle” which has formed over the past months, indicating that after putting in a low in November, bears could not drive the USD/CAD to new lows. Overall, the cup and handle is bullish, though traders will absolutely want to keep an eye on ascending support of the relative range, just in case.
Because Canada is a commodity-backed economy, it could pay to keep an eye on oil in the coming weeks. Should oil stage another breakout – above $110 a barrel – the USD/CAD could surprise bulls with another leg lower. Conversely, a move above lateral resistance at 1.0400 would be markedly bullish.

3. AUD/CAD Recently Broke Neckline of 3-Year Trend
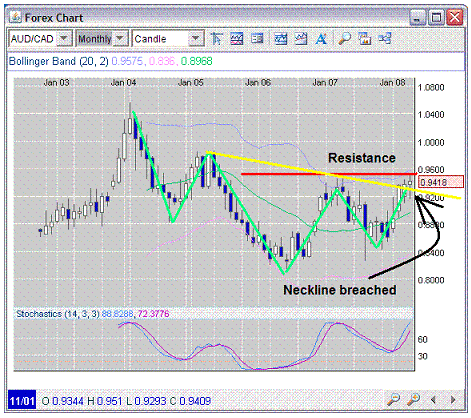
Looking at a MONTHLY chart of the AUD/CAD, we see that the Australian dollar recently staged a move above the neckline of the 3-year inverted head and shoulders. Right now, the AUD/CAD needs to move above whole number resistance at 0.9600 for the bullish trend to continue.
It’s important to note that while the pair is now above the neckline, it is also trading near the top band of the 21-month Bollinger Band, which is adding supplemental resistance to Aussi bull’s plans. What’s more, usually when a chart breaks a neckline with confirmation, the move is rather dramatic; this is not the case for the AUD/USD. Traders need to mark the lack of bullish Chutzpah in the AUD/USD and keep stops tight as resistance at 0.9600 could still hold.
This story still has some time to unfold, but traders will want to put the pair on their radar screens.

Exit is everything.
Sign up for a free trial to Forex Force with Mark Whistler, a twice-daily alert service from professional trader Mark Whistler featuring intraday and swing trading setups. Click here to start your free trial.
