Four Names With Strong Pullback Patterns
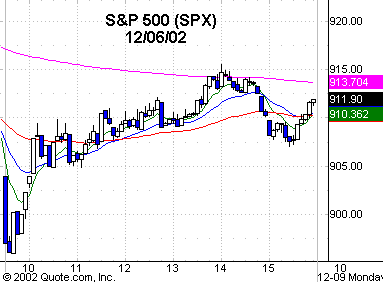
Friday’s early red futures and down opening
gave us a good contra move in the major
index proxies, HOLDRs and, of course, many stocks. The SPX
(
$SPX.X |
Quote |
Chart |
News |
PowerRating) had
entry above 900.30, as it traded to an intraday high of 915.48 without any
threat of getting stopped out. Entry came on a re-cross of the 50-day EMA to the
upside. Once again, it was using a higher time frame pivot point in conjunction
with the Trap Door intraday setup and a positive trade resulted.
The
(
SMH |
Quote |
Chart |
News |
PowerRating)s opened
down about a point at 25.73, traded down to an intraday low of 25.40, which
proved to be the signal bar, as it closed at the high of 25.60, and entry was
above that high on the next bar. The SMHs traded up to an intraday high of 26.49
before closing at 26.09 in the middle of the day’s range. This is now the second
profitable trade taken in that 25.25 – 25.85 zone that I have mentioned in
previous texts, so we can’t assume that this will continue to happen. It is
usually the first and second approaches to an inflection point that usually
produce the best reflex. The zone then gets resolved and the market moves on.
Friday’s end-of-week
small up day was on below average NYSE volume of 1.25 billion, a volume ratio of
60, and breadth +723, certainly no surprise after the five straight down closes.
The SPX ended +0.6%, the Dow
(
$INDU |
Quote |
Chart |
News |
PowerRating) +0.3%, and NDX
(
$NDX.X |
Quote |
Chart |
News |
PowerRating) +1.2%.
Most of the major sectors ended with small gains, while the SMHs were almost
unchanged at -0.1%. If we go green today, the SMHs could close the gap between
27.90 and 27.37. Gold continues its move with five straight higher closes, as
the
(
$XAU.X |
Quote |
Chart |
News |
PowerRating) ended +3.4% on the day, and at the same time, the US dollar
closed at the lows of the past five days.
In previous texts, I said
that I thought that the major indices, and certainly the SMHs, would pull back
from those resistance zones mentioned, and that I thought they could get an
upside move from the 12/17 – 12/20 period into year’s end, assuming event risk didn’t
kick in. So far, the SPX has declined just over 6.0% to the 50-day EMA,
re-crossed it to the upside, closing at 912.23 and in the top of the range,
setting up a pullback pattern potential entry above Friday’s high. The SMHs have
declined 18% from 31 to Friday’s 25.40 low, closing at 26.09. The 25.40 intraday
low was right at the 50-day EMA, with the 89-day EMA at 25.85. In addition to a
minor cycle date on Dec. 11, and the more significant Dec. 17 – 20 period, there
is a major option expiration on Dec. 20. Because of the current percentage
pullback, any early upside trading move starting this week should not be a
surprise.
In addition to the major
index proxies and SMHs that have all pulled back, there are many stocks that
have had strong moves over the past four to six weeks that have similar pullback
patterns to rising 20-day or 50-day EMAs. A few examples are
(
BRCM |
Quote |
Chart |
News |
PowerRating),
(
CMVT |
Quote |
Chart |
News |
PowerRating),
(
CYMI |
Quote |
Chart |
News |
PowerRating) and
(
SNDK |
Quote |
Chart |
News |
PowerRating), just to name a few. I look for these
on
TradingMarkets’ Stock Scanner using a greater than 20-day, 50-day and
200-day EMA filter, and also ADX greater than or equal to 25. You put your own
minimum price and volume criteria in depending on what your trading style is.
I then go through each chart to see the pattern and where they close in their
range on Friday and what the volume was relative to the 30-day average daily
volume, which is available on my SPX 500 and NDX 100 screens. I will also look
to the biotech sector this week for intraday setups, as this is a seasonal
strength time for this sector.
Have a good trading day.
Do the work. There are many stocks that set up, just go through the screens.

Five-minute chart of
Friday’s SPX with 8-, 20-,
60- and 260-period
EMAs

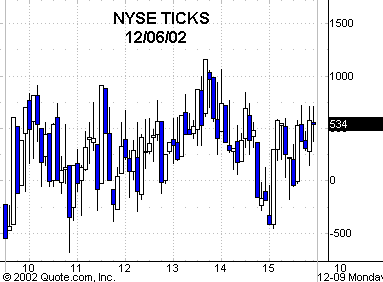
Five-minute chart of
Friday’s NYSE TICKS
