Four Numbers To Watch Today
The December S&P 500
futures (SPZ and ESZ) opened Wednesday’s session with a +5.75 point
gap to the upside, and just under weekly Fib resistance, due to hype from
Intel’s rosy earnings picture and the 2nd-tier Empire State Index coming in
higher-than-expected. Good broker selling off the open trapped the longs as
Goldman Sachs was a heavy seller of a couple hundred SPZ contracts. The
contract found some initial support and formed a bear flag off of Tuesday’s high
at 1,049.50 before another wave of selling filled the opening gap and then some,
pushing the futures through the Daily Pivot at 1,045.25 and to the session low.
After a grind back up, the contract did a dance around the flat line for the
next 2-1/2 hours until good selling pressure came back in and cracked the
futures down to a new session low at 1,041.50. The combination of 60-min,
120-min, and S1 support gave the futures enough of a floor to attract some
buying back up through the Daily Pivot, where it settled just below.
The December S&P 500 futures closed Wednesday’s
session with a loss of -3.00 points, and finished in the lower 1/2 of its daily
range. Volume in the ES was estimated at 661,000 contracts, which was ahead of
Tuesday’s pace, but below the daily average. On a daily basis, the contract
posted a market structure high and settled on the lower trend line of its rising
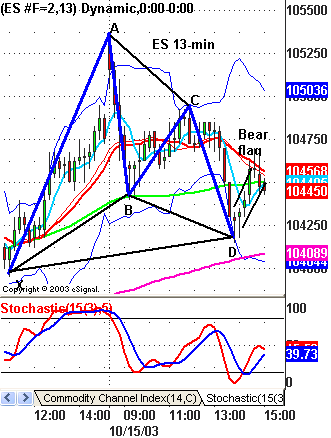
wedge pattern. On an intraday basis, the 60-min chart reversed off of its
multi-day uptrend line support in the 1,042 area but stalled at MA resistance,
while the 13-min chart broke a bullish Gartley to the upside before stalling
into a bear flag at 15-MA resistance (see chart).

Thursday is a heavy economic report day.
Starting at 8:30 am ET, we have the Weekly Jobless Claims, with its consensus
for a slight uptick to 390,000. More importantly, market players will be
watching for the weekly average to remain below the key 400,000 level. Also on
the schedule is the September Consumer Price Index and its consensus of a 0.2%
increase. That is followed by the August Business Inventories, September
Industrial Production, and September Capacity Utilization. If that’s not
enough, we have the October Philly Fed at 12 noon and its consensus of 15.6. We
may see some upward revisions to expectations for this report based on the
strong Empire State Index number.
Daily Pivots for 10-16-03
| Symbol | Pivot | R1 | R2 | R3 | S1 | S2 | S3 |
| COMP | 1946.33 | 1959.64 | 1980.17 | 1993.48 | 1925.80 | 1912.49 | 1891.96 |
| INDU | 9805.84 | 9847.22 | 9891.39 | 9932.77 | 9761.67 | 9720.29 | 9676.12 |
| NDX | 1422.44 | 1435.12 | 1452.64 | 1465.32 | 1404.92 | 1392.24 | 1374.72 |
| SPX | 1047.90 | 1052.65 | 1058.54 | 1063.29 | 1042.01 | 1037.26 | 1031.37 |
| ESZ | 1047.25 | 1053.00 | 1061.50 | 1067.25 | 1038.75 | 1033.00 | 1024.50 |
| SPZ | 1046.60 | 1051.70 | 1058.90 | 1064.00 | 1039.40 | 1034.30 | 1027.10 |
| NDZ | 1422.83 | 1435.67 | 1454.83 | 1467.67 | 1403.67 | 1390.83 | 1371.67 |
| NQZ | 1423.83 | 1437.17 | 1457.83 | 1471.17 | 1403.17 | 1389.83 | 1369.17 |
| BKX | 937.68 | 941.96 | 947.07 | 951.35 | 932.57 | 928.29 | 923.18 |
| SOX | 478.03 | 483.71 | 492.02 | 497.70 | 469.72 | 464.04 | 455.73 |
| DIA | 98.30 | 98.75 | 99.28 | 99.73 | 97.77 | 97.32 | 96.79 |
| QQQ | 35.35 | 35.68 | 36.17 | 36.50 | 34.86 | 34.53 | 34.04 |
| SPY | 105.17 | 105.71 | 106.42 | 106.96 | 104.46 | 103.92 | 103.21 |
| SMH | 39.50 | 40.08 | 41.00 | 41.58 | 38.58 | 38.00 | 37.08 |
Fair Value & Program Levels
Fair Value — (1.42)
Buy Premium — (0.68)
Sell Discount — (2.35)
Closing Premium – (2.26)
Please feel free to email me with any questions
you might have, and have a great trading day on Thursday!
