Friday’s Stock Watch
The major indexes ended the
day in positive territory, as the NYSE chalked up slightly above
average volume, and the Nasdaq came in with heavy volume, though after factoring
out the Worldcom shares it was average. The biggest gainers of the day were
Internet, software, computer technology, and semiconductors, while banks,
airlines, insurance, and transportation stocks were the biggest losers. New
52-week lows once again got the better of the highs, with drugs,
telecommunications, software, and electronics putting up the highest numbers. We
are removing two of the stocks from our watch list.
Market breadth was mostly negative, with NYSE
declining issues over advancing issues by a ratio of 1.69, and down volume over
up volume by a 1.04 ratio. Nasdaq declining issues over advancing issues came in
at 1.38, though up volume beat down volume by a 2.14 ratio.
The Dow Jones Industrial Average
(
$INDU |
Quote |
Chart |
News |
PowerRating) closed up 0.51% at 9054.34. The S&P 500
(
$SPX |
Quote |
Chart |
News |
PowerRating)
closed up 0.61% at 953.97.
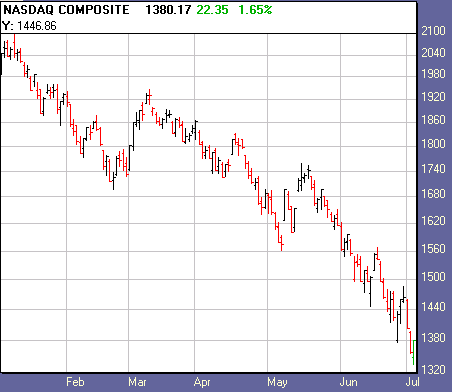
The Nasdaq
(
$COMPQ |
Quote |
Chart |
News |
PowerRating) closed up
1.64% at 1380.09.

Â
  1,215
 1,487
Declining Issues
 1,903
 1,899
 824,557,730
 1,106,710,359
 942,497,370
 462,456,080
Total
Volume
  1,780,861,070
   1,618,422,473
Highs
  52
79
188
247
Top sectors:
GSTI Internet Index
(
$GIN.X |
Quote |
Chart |
News |
PowerRating), up 5.94% at
68.09.
GSTI Hardware Index
(
$GHA.X |
Quote |
Chart |
News |
PowerRating),
up 5.49% at 172.52.
Losing sectors:
FTSE Eurotop 100 Index
(
$TOP.X |
Quote |
Chart |
News |
PowerRating), down 2.69% at
2245.39.
Airline Index
(
$XAL.X |
Quote |
Chart |
News |
PowerRating) down 1.53% at
61.63.
Sectors with Most New 52-Week Highs (10 or more):
None
Watch List Action:
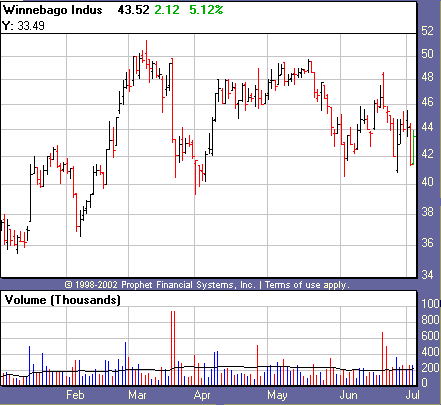
Winnebago Industries
(
WGO |
Quote |
Chart |
News |
PowerRating) was our biggest gainer today as it rose 5.43%
on above average volume. The price action needs to move higher with accumulation
before we can get excited, though the fundamentals are strong, as the company
increased its earnings 50% for the last two quarters on a year to year basis.Â

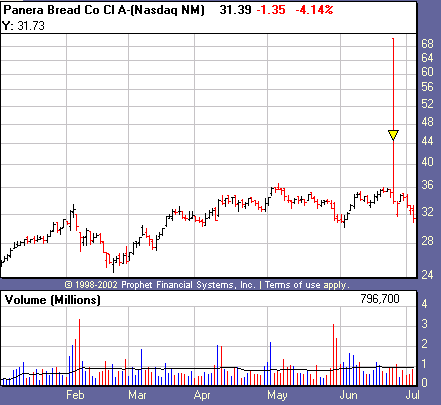
Panera Bread Company
(
PNRA |
Quote |
Chart |
News |
PowerRating) fell 4.14% on below average volume for its
second distribution day in a row. The stock had a recent 2 for 1 split, and has
now cut back into the base of its most recent pivot buy point. The stock has had
a good run though will be coming off the list now. The company’s CEO was
recently on CNBC talking up his business… this is often another indication
that a stock has overextended itself.

Recent Breakouts
size=2>We monitor the action of Recent Breakouts as an indicator of
the market health for IT traders. When breakouts are acting well, this is a good
sign for the likelihood of further sustainable breakouts. When breakouts are
failing, IT traders should be even more cautious.
Christopher & Banks
(
CHBS |
Quote |
Chart |
News |
PowerRating), down 0.17% on
average volume for a distribution day.
size=2>Panera Bread Co
(
PNRA |
Quote |
Chart |
News |
PowerRating), down 4.15%
on below-average volume for its second distribution day
in a row.
| color=#ffffff size=2>Company Name | color=#ffffff size=2>Symbol | color=#ffffff size=2>12 Month RS | color=#ffffff size=2>Price | color=#ffffff size=2>Price Change | color=#ffffff size=2>Average Volume | Pivot | 52-Week High |
Christopher & Banks | ( CHBS | Quote | Chart | News | PowerRating) | 94 | 40.02 | – 0.07 | 346,500 | 33.60 | 42.45 |
size=2>Panera Bread Co | size=2> ( PNRA | Quote | Chart | News | PowerRating) | 93 | 31.39 | – 1.36 | 924,600 | 33.12 | 36.80 |
Stocks Forming a Handle
Apollo Group Inc.
(
APOL |
Quote |
Chart |
News |
PowerRating), up 0.49% on
below-average volume.
| color=#ffffff size=2>Company Name | color=#ffffff size=2>Symbol | color=#ffffff size=2>12 Month RS | color=#ffffff size=2>Price | color=#ffffff size=2>Price Change | color=#ffffff size=2>Average Volume | Pivot |
Apollo Group Inc. | ( APOL | Quote | Chart | News | PowerRating) | 84 | 38.38 | + 0.19 | -0.23 | 2,210,600 |
Stocks Building A Base
Coach Inc.
(
COH |
Quote |
Chart |
News |
PowerRating), down 1.42% on below-average
volume for its second distribution day in a row.
Dollar Tree Stores Inc.
(
DLTR |
Quote |
Chart |
News |
PowerRating), down 3.61%
on above average volume. This stock broke south of its base, and will be off
the list.
DR Horton Inc.
(
DHI |
Quote |
Chart |
News |
PowerRating), down 1.13% on below-average volume.
Penn National Gaming
(
PENN |
Quote |
Chart |
News |
PowerRating), up 1.08% on
almost half its average volume for an accumulation day.
Winnebago Industries
(
WGO |
Quote |
Chart |
News |
PowerRating), up 5.12% on
above-average volume.
color=#ffffff size=2>Company Name | color=#ffffff size=2>Symbol | color=#ffffff size=2>12 Month RS | color=#ffffff size=2>Price | color=#ffffff size=2>Price Change | color=#ffffff size=2>Average Volume |
Coach Inc. | ( COH | Quote | Chart | News | PowerRating) | 91 | 50.43 | – 0.73 | 611,700 |
Dollar Tree Stores Inc. | ( DLTR | Quote | Chart | News | PowerRating) | 91 | 35.15 | – 1.32 | 1,323,600 |
DR Horton Inc. | ( DHI | Quote | Chart | News | PowerRating) | 88 | 25.19 | – 0.29 | 1,508,400 |
Penn National Gaming | ( PENN | Quote | Chart | News | PowerRating) | 88 | 15.85 | + 0.17 | 639,200 |
Winnebago Industries | ( WGO | Quote | Chart | News | PowerRating) | 90 | 43.52 | + 2.12 | 209,900 |
href=”mailto:danielb@tradingmarkets.com”>danielb@tradingmarkets.com
If you are new to the “IT” strategy, be sure to
take a look at our
intermediate-term online trading course.
