From A Cycle Standpoint, This Scenario Is Possible
The
rising wedge for the major indices,
accompanied by the declining volume for
the month of May, in addition to the significant decrease in daily range as
volatility narrowed, gave way to an air pocket decline yesterday. It also comes
at the 2.0 standard deviation zone. (See the
commentary from 5/16.) The current move wasn’t expected to extend beyond 940
– 954 without some retracement. (See the
5/6 commentary.) There was a three-bar reversal down on 5/8 for the SPX
(
$SPX.X |
Quote |
Chart |
News |
PowerRating) after the 5/6 939.61 high, but that was followed by two
wide-range-bar days up with the high at 948.23, or another +0.9% preceding
yesterday’s air pocket.
The decline had the SPX
-2.5%, Dow
(
$INDU |
Quote |
Chart |
News |
PowerRating) -2.1%, Nasdaq
(
$COMPQ |
Quote |
Chart |
News |
PowerRating) -3.0%,
(
QQQ |
Quote |
Chart |
News |
PowerRating) -3.6%,
and
(
SMH |
Quote |
Chart |
News |
PowerRating) -4.3%. The VIX jumped about 10%, and the
(
BBH |
Quote |
Chart |
News |
PowerRating)s went
countertrend and advanced +4.9%. NYSE volume was not heavy at 1.3 billion, but
that is more the norm when an extended situation has an air pocket. It is the
volume that follows the initial air pocket that matters more. The volume ratio
was all one-sided at just 11, and breadth was -1301.
The media jumped on the
dollar decline yesterday, which of course, has been declining throughout this
excellent +20% rally for the SPX from the 789 low on 3/12, and +23.4% from the
October 769 low. I just say the rubber band was extended and stopped after a
period of narrow volatility, and now we are looking for the next move after a
retracement from an overbought condition. The Dow is back to the 200-day EMA, so
that is a pivot in play again. For the SPX, the 200-day EMA is 909, the .236
retracement to 789 is 911. The 200-day SMA is down at 885, and 888 is the .382
retracement to 789. 884 is the .50 retracement to the 1987 low from the 1553
all-time high. To clear the decks for any sustained advance, I would want to see
at least a .38 retracement to the 789 low and that applies also to the Dow, QQQs
and SMHs. The QQQ 200-day EMA is 26.79 and closed yesterday at 27.68. The SMH
closed at 26.62 vs. its 200-day EMA at 26.52 and is a pivot in play today,
especially if there is a re-cross up after trading below it in early trading.
The early futures are
slightly green, but that can change quickly, as you well know. I would rather
have yesterday’s low taken out first, then reverse those lows up, giving us an
opportunity, then you would be ready to reverse to the short side if they headed
south again. This volatility is the kind of travel range you look for on an
intraday basis.
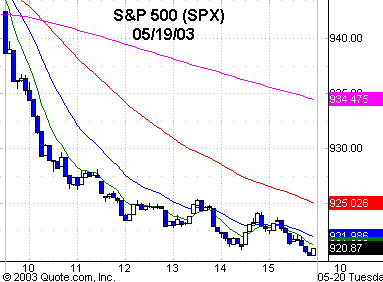
In yesterday’s trading,
which was a trend down day from the opening bell to the close, there was no
daylight. This corner stopped out on a Trap Door, and again at the 2.0
volatility band for the SPX of 927, where price traded for 19 five-minute bars
between 928 and 926, but resolved itself to the downside, with the SPX closing
at 920.77. The TRIN spent most of the day above 3.0. These kind of trend days
don’t occur more than two or three times a month for the S&P futures, and that
would be on the high end.
From a cycle standpoint,
which in my opinion, is very subjective, the SPX will probably make a 1,2,3
lower top after this retracement and could even make a marginal new rally high,
which is less likely, but then a four- to six-week decline through the month of
July into early August. I outline this scenario in preparation and treat it just
like any other awareness level so I am ready to capitalize on any setups around
this time zone.
For today, if there is
more decline, there will be a contra move. 20-day 30-minute chart has a 2.0
standard deviation around 915 and the 3.0 band at about 905. 920 is the
ascending triangle top where this initial leg started from, and it has already
tested once before. If we get that lucky, good for us. But if not, we should get
at least one good long and short play in the SPX today.
Have a good trading day.

Five-minute chart of
Monday’s SPX with 8-, 20-,
60- and 260-period
EMAs

Five-minute chart of
Monday’s NYSE TICKS
