Gamma Trading Options Part I: Adjusting Exposure to the Market
The recent spate of volatility has forced traders to reassess their strategies from soup to nuts. Everything from position size, duration of holding, stop losses, and correlation coefficients have come under more intense examination, as the various asset classes of the trading world are more inextricably linked than ever before.
Because of these conditions, a strategy that has taken on more of a prominent role in my portfolio management style is gamma trading. I define gamma trading as using options to take on a particular view point in the market, while using the underlying to dynamically adjust my exposure, according to my evolving view point.
Click here to learn how to utilize Bollinger Bands with a quantified, structured approach to increase your trading edges and secure greater gains with Trading with Bollinger Bands® – A Quantified Guide.
As a trader who loves to take on exposure at major inflection points in the market, one of the areas I have to be cognizant of is the tussle that goes on, back and forth, between the bulls and the bears at these key levels. Using my gamma trading strategy, I am about to explain, you will be able to see how this tussle creates some opportunity to reduce one’s cost basis in the trade and work around a position in a more dynamic fashion. This is made possible because of the metrics that exist when setting up options trades on a position.
Before proceeding, it would help if readers gained a basic understanding of the Greeks that go into understanding the basics of option pricing. There are a number of sites online where this information can be found. It is important knowledge to learn and it is something I spend a good percentage of the early portion of the classes I teach on gamma trading options. Learning a basic background on this helps burgeoning traders get caught up to speed.
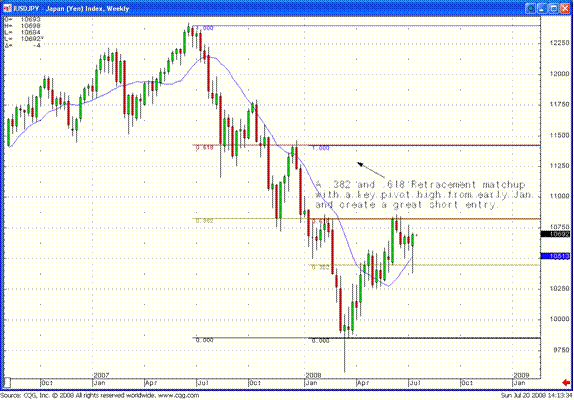
Our first example using this scenario is a short position I took on in USD/JPY currency pair, or long the yen futures on the CME. I put this trade on in the middle part of June, as the weekly chart of the cross was reaching a luscious inflection point, thereby necessitating a position that would create some nice short exposure (see below chart).
The process of picking spots to either take on a bullish or bearish position is not the main focus of this article per se, but by executing this through a gamma trading strategy, it enhances the flexibility that one can employ when managing this position. I put nearly all of my trades for this strategy on through the futures (Yen September Contract), as in my experience, the options on the CME FX futures have been more liquid and tightly priced than what I have seen from any comparable FOREX platform.

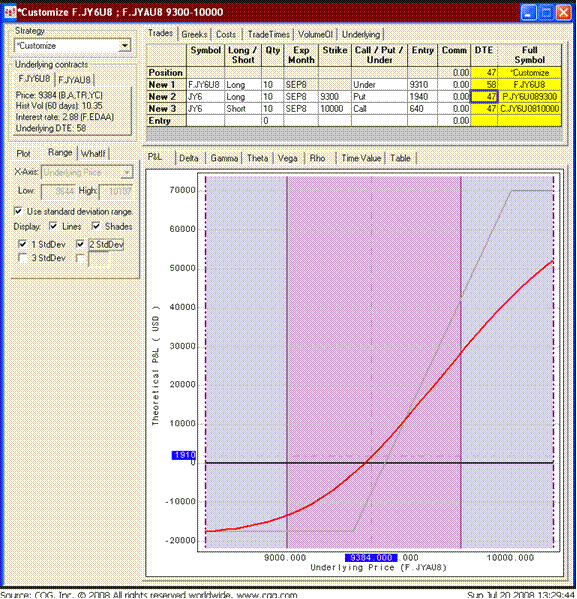
With the yen futures trading at 9310, (USD/JPY at 10800) I went long on the underlying September contract. I simultaneously purchased a September 9300 put and sold a 10000 September call. The two options expire on September 5, or about 80 days later, and incurred a debit to the account of 130 ticks (September Puts cost 194 ticks, September Calls were sold for 64 ticks thereby leaving the debit of 130). My break-even point on the trade was at 9440 and my max upside was for the Yen to return to parity with the dollar at 10000. With each tick on the Yen worth $12.50, I was risking a total of 140 ticks (130 from the debit and 10 from the underlying as I entered at 9310) or $1,750 per contract, with a max upside of $7,000 per contract if the reversal that I saw happening over the next 80 days took place. (see risk-reward profile below)

By doing this I have managed to accomplish a few things: the first is taking on a bullish Yen position and clearly defining my risk. The second is to put myself in the market so that I can begin to trade around a core position at key spots, offsetting some Yen exposure at areas of value. I am doing this fully understanding that if things really get moving in my favor, i.e. the Yen starts to rally hard, I won’t be hurt, because the upward explosion of the position and increase in gamma will more than offset the bullets that I have fired when trying to trade around my core.
Since I put on a 10 lot, I will be trading 1-3 contracts at most key spots on the charts, where I think the Yen can come under pressure, and sell down. I will be more liberal with some special situations, allowing me to sell as many as 5 contracts of the 10 that are in the position. This allows some maneuverability by reducing my exposure to the underlying when we hit critical spots, much like taking profits if I was just trading the underlying with no options at all. This is important because I am going long on the yen on a weekly chart, yet the daily was still bearish. Near most of these major tops, there is typically going to be a lot of give and take in terms of price action. Having a strategy that lets you grab some of that push and pull puts another tool in your array of trading weapons.
Using a flexible strategy to trade around a core position can help offset the time decay, as well as serving as a backstop, in case you are wrong when attempting to dynamically adjust your exposure. This is why gamma trading is ideally done with your initial position containing multiple options contracts (at least four, but preferably 10 or more)
The time decay in this position, like all options positions, grows exponentially larger as you approach expiration. For the month of June, I was staring at time decay in the area of $25 a day per contract (September 9300 puts were losing about $30 a day and September 10000 calls were making us about $5 a day per contract). I put the position on for a 10 lot, so $250 a day was the vig. If all other things stayed equal (specifically the price of the underlying and implied volatility), I would have to make $250 a day by trading around the position to offset this deterioration.
Gamma trading allows a trader to materially alter the risk-reward profile of a trade in ways that, if they were exclusively trading the underlying, would not offer such choices. As a hedge fund manager, it’s my job to deliver the best risk-adjusted return possible. A common misconception, not openly discussed in mainstream media, is that when many institutions look to allocate capital, they are more concerned with the drawdown and risk management capability of the underlying manager, rather than the outright return. This has helped studies like the Sharpe and Sortino ratios to become a mainstay of financial tools, as they do a better job of analyzing the skill-set of a manager than just an arbitrary return.
Part II of gamma trading options will walk us through the next step of trade management for this position and how offsetting our yen exposure changes the position metrics and redefines our risk-reward profile. We will discuss the pros and cons of these actions and how this fits into our overall strategy. Future articles will touch on more strategies and how to work short gamma strategies in markets that have priced volatility in too high.
John Netto is President of One Shot – One Kill Trading, LLC and CEO of M3 Capital, LLC. He is the author of “One Shot – One Kill Trading: Precision Trading through the Use of Technical Analysis (McGraw-Hill, 2004). John, a nine-year US Marine Corps Veteran, currently hosts the Web TV Show, “SniperScope Live Trading”, where he displays his trading positions, working orders, and analysis in real time for viewers to see. He posts free written and audio blogs at his web site, www.osoktrading.com.
