Generals Pullback Zone Alert
Last week was a key longer-term time zone in
confluence with a shorter-term price and time zone. I said that if the market
advanced into last week to the retracement zones of the
(
SPY |
Quote |
Chart |
News |
PowerRating) 123.25 03/07
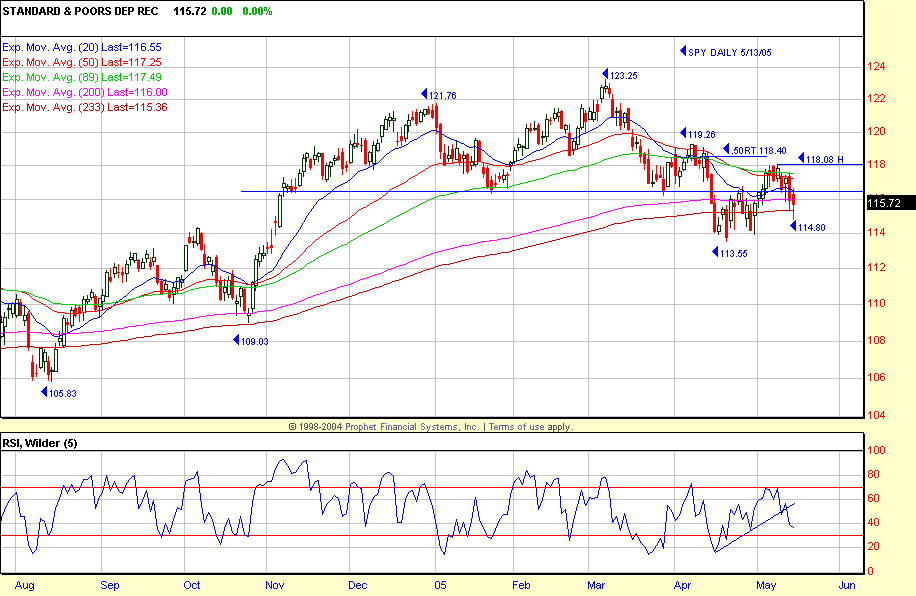
high that the highest probability was a downside reversal. The SPY rallied 13
days to its 118.08 high last Monday and was short-term overbought on the 5 RSI,
in addition to a 4 MA of the volume ratio at 65 and 4 MA of breadth at +760. The
reversal last Monday took the SPY down to a 114.80 intraday low on Friday before
closing at 115.72. The 200-day EMA is 116 and the 233-day EMA 115.36, so that is
the immediate focus on Monday depending on where the “Game” takes price.
The
(
DIA |
Quote |
Chart |
News |
PowerRating)
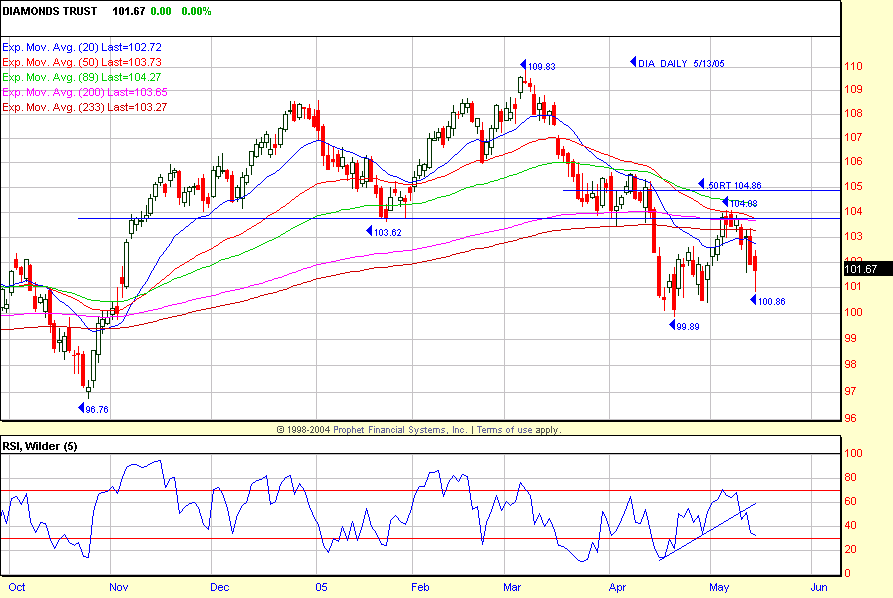
was unable to close above 104 resistance, hitting a 104.08 high on 05/05 and
declining to a 100.86 intraday low on Friday before closing at 101.67, well
below its 233-day EMA (103.27) and 200-day EMA (103.65). The 20 EMA < 50 EMA <
200 EMA, so this is a “below the line” index, as is the Nasdaq Composite. The
(
IWM |
Quote |
Chart |
News |
PowerRating)
had traded down by -13.5% from its 12/31/04 year-end close to a 113 low on
04/29/05 vs. its .618 retracement (113.21) to the August low. The initial
support was the 120 level, which has now become the current primary resistance,
along with the 200-day EMA at 119.42. The anticipated plan of action was to take
a short-term bias on a retracement to the 119.40 – 120 zone. Last Monday, the
IWM hit 120 and reversed down to 114.89 on Friday, closing at 116.18. The IWM
(Russell 2000) topped out following the current
(
QQQQ |
Quote |
Chart |
News |
PowerRating) 12/15/04 40.68 cycle
high.
Last week there was a positive divergence for
technology, due mostly to Friday’s action. The QQQQ was +1.1% on Friday and
+1.1% on the week, greatly attributed to
(
DELL |
Quote |
Chart |
News |
PowerRating)‘s +7.4% day on Friday due
to announced earnings and a bevy of hedge fund shorts running to cover, in
addition to the herd of retail investors that do nothing but buy announced
earnings and lose 95% of the time. DELL was a “below the line” stock into Friday
with Thursday’s 36.61 close, below its declining 200-day EMA of 37.84. The
(
SMH |
Quote |
Chart |
News |
PowerRating)
was +2.5% on Friday and +2.6% on the week.
Spring has been friendly to
technology stocks, so we must be alert to the large hedge funds and Generals
that might try to push the seasonal bias to get this market turned around.
Because of the technology weighting in the S&P 500
(
$SPX.X |
Quote |
Chart |
News |
PowerRating), it would
benefit a bit more than the Dow
(
$INDU |
Quote |
Chart |
News |
PowerRating) if they could get the techs going.
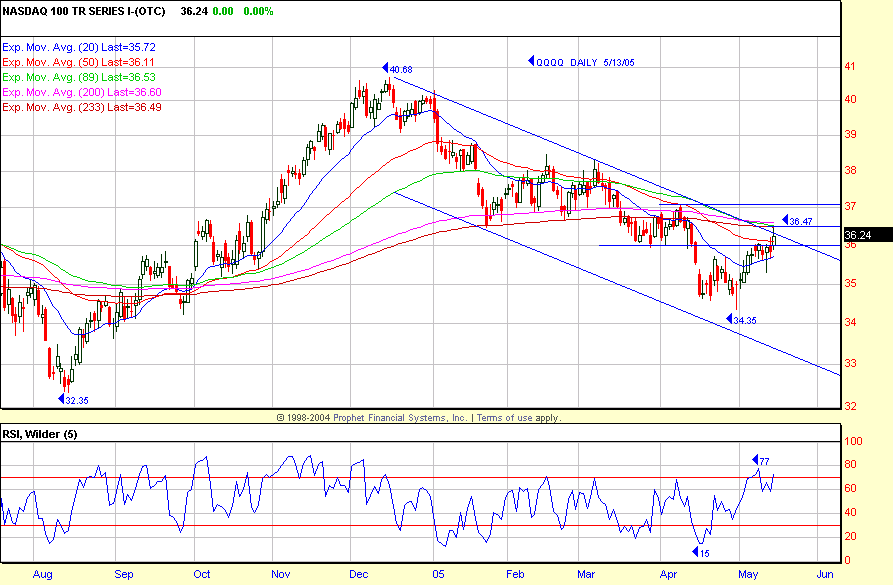
The QQQQ had declined 20.5% from 40.68 (12/15/04) to 34.35 (04/29/05). The QQQQ
closed Friday at 36.24 vs. its 233-day EMA of 36.49 and 200-day EMA of 36.60,
which is also the downward channel line from that 40.68 high.
On Friday, the SPX hit an 1146.18 intraday low
and closed at 1154.05, -0.5%. The initial trading focus on Monday is 1155.08
(233-day EMA) and 1160.76 (200-day EMA). Depending on Monday’s action, you must
be ready to work the lines both ways as daytraders. The Dow was also -0.5% to
10,140, the Nasdaq +0.7% and QQQQ +1.1% to 36.24. NYSE volume expanded to 1.72
billion shares (most for the week) with a volume ratio of just 27 and breadth
-825, which indicates the narrow positive impact of a few technology stocks.
In the primary sectors, the SMH was the only
positive one on the week at +2.6% (all on Friday). The downside was led by the
(
OIH |
Quote |
Chart |
News |
PowerRating),
-6.2%, of which, -5.5% came on Thursday and Friday as crude oil took a dive.
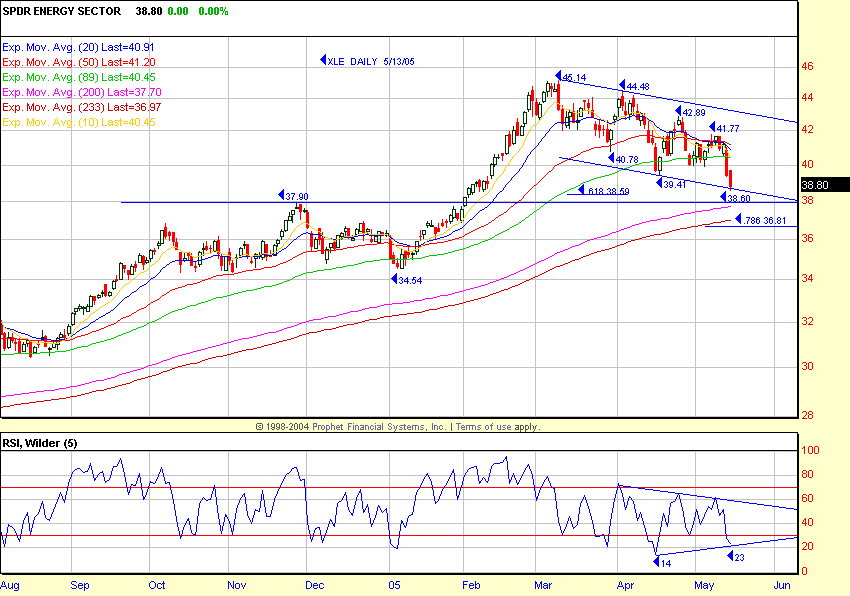
Keep in mind the XLE was + 31% in 42 days from 34.54 (01/06/05) to 45.14
(03/09/05). The angle of advance was extreme, and the XLE never traded once
below its 10-day EMA until the 45.14 high. The XLE had advanced +129% since the
07/24/02 low, so obviously the Generals have been taking money off the table
since the 45.14 high. However, this decline from that high has been the biggest
source of profit for daytraders trading the retracements to the 20-, 50- and
89-day EMAs. The XLE closed at 38.80 on Friday at the bottom of its downward
channel and is entering the Generals’ pullback zone which is a level where the
Generals will probably roll back into some stocks that they had sold higher. The
.618 retracement to 34.54 is 38.59, then there is the 37.90 support level,
followed by 37.70 (200-day EMA) and 233-day EMA (36.97). The 89-day EMA gave
daytraders lots of very profitable long action on three occasions, and you can
bet we will get more in this most important zone. This is the first retracement
to the longer-term moving averages since August 2003.
There was another excellent play for daytraders
last week, in that the
(
TLT |
Quote |
Chart |
News |
PowerRating) rallied for five straight days at +1.9% on the
week, while the XAU declined -8.1%, which was also attributed, in part, to the
drop in crude oil. This set up excellent short continuation trades in, for
example,
(
NEM |
Quote |
Chart |
News |
PowerRating) which will be discussed this week in the
Inner Circle.
The performance of the sector SPDRs over the past
month outlines the perception that it is late in the business cycle and growth
has slowed, yet is still expanding, so the portfolio weightings have shifted to
a more defensive posture, as evidenced by the relative performance of healthcare and consumer staples.
We start the week and should be watching whether
there are any seasonal games starting in technology, whether the Generals come
back for some of the energy stocks as the XLE approaches its longer-term moving
averages, and we should also be ready to take advantage, on the short side, of
those “below the line” indices and big-cap stocks on retracements to the
longer-term declining moving averages.
Obviously, I had lots of time on my hands Sunday,
but the “Game” will continue to get exciting through June for sure.
Have a good trading day,
Kevin Haggerty
P.S. I will be
referring to some charts here:
www.thechartstore.com in the future.


