Get Out Of The Box
The
merry-go-round continues, as
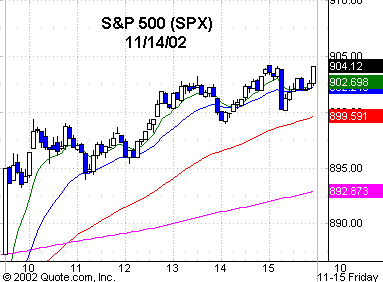
does the volatility. Yesterday wasn’t a good trading day, as there was the early
7 to 8 point opening run on the first five-minute bar, then a pause at the 900
level on the SPX
(
$SPX.X |
Quote |
Chart |
News |
PowerRating) at the 10:05 a.m. ET bar before going sideways
forming a triangle into the 12:30 p.m. bar where it broke out above 899 and just
moved to 904.12 and closing there.
It’s been quite a
five-day stretch, with the bottom line basically unchanged. For example, the Dow
(
$INDU |
Quote |
Chart |
News |
PowerRating) closed at 8537 on Nov. 8 and closed yesterday at 8542 in spite of
all the two-way hype in the media and by analysts. The Dow is -0.6% in five
days. We had some action around that number, as the five-day high was 8669 and
the low 8299, so daytraders had opportunity, certainly with the two-way action
in the semiconductors. Those of us that are shorting into the bond market rally
had a gift yesterday, as the TLTs hit an air pocket.
Yesterday’s up in the
major indices carried across all major sectors, which is always positive. NYSE
volume was just 5.0% above average at 1.5 billion, but the volume ratio was
strong at 85, and breadth +1485. The net breadth figure for the five days is
just +116, which confirms the Dow and the two-way emotion.
My thoughts on
retracement or continuation of the first leg is in
Wednesday’s text, and that hasn’t changed as neither the SPX or NDX
(
$NDX.X |
Quote |
Chart |
News |
PowerRating) has retraced at least .38 to the October lows. The Generals will
determine that time frame and from what level. My November text titled “Locker
Room Talk” sums up my overall thoughts. I am not one that changes on each
one-day knee-jerk up or down unless it’s extreme overt news with corresponding
volume. Please don’t e-mail me about what I think after each day’s daily noise,
just save my commentaries and re-read them. Most of the e-mails seem to be from
individuals that have missed the move from the 1,2,3 lower bottom on the
reversal of the 776 low, which I documented, in addition to the confluence of
the other key inflection points that I have referred to.
As a trader, I am talking
about taking advantage of high-probability moves, long or short, in this bear
market. For example, the SPX declined 51% so far from the 1553 March 24, 2000,
top, so that’s the max that you could have made if you were short at the exact
top. Wrong. My trading view of the markets is focused on the fact that there
have been five downside moves totaling -123% since the 1553 top. They are -19%,
-22%, -28%, -34% and -20%, and they all came from retracements to the
longer-term moving average. After each decline, the SPX had five rallies
totaling +101%. They were +10%, +22%, +25%, +24% and now this current one at
+20% so far. If you develop your sequence trading skills and get out of the box,
your opportunities will expand exponentially as I pointed out with the combined
224% of opportunity vs. the absolute 51% down from the 1553 top. You decide. If
you want to talk subjectively about the market, then go on CNBC, but don’t
e-mail me.
Have a good trading day.

Five-minute chart of
Thursday’s SPX with 8-, 20-,
60- and 260-period
EMAs

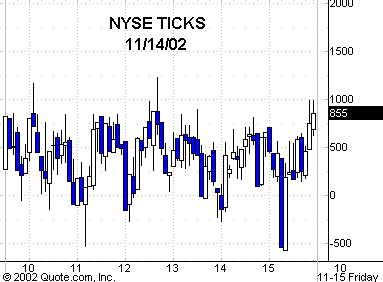
Five-minute chart of
Thursday’s NYSE TICKS
