Getting Directional Help From A Gap
Traders and investors always overreact to news and rumors. I have never seen
an appropriately behaved crowd in the market. Emotions, such as fear and greed,
control us, and the gaps are excellent evidence of our irrational behavior.
Gaps are easily spotted on the charts, and they can teach us important
lessons.Â
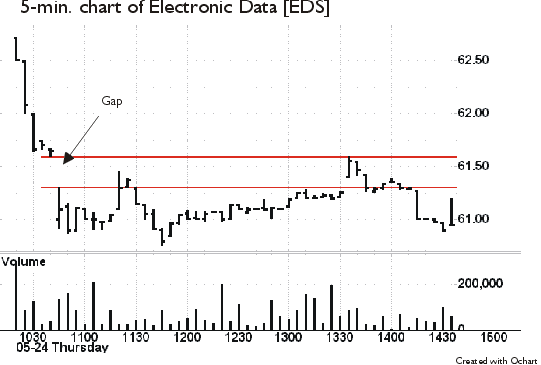
The chart below is a five-minute chart of Electronic Data (EDS).
As you can see, shortly before 11:00 a.m., the stock gapped down. Look how the stock
traded after the gap. It was a clear example of how a gap became a resistance
level.Â

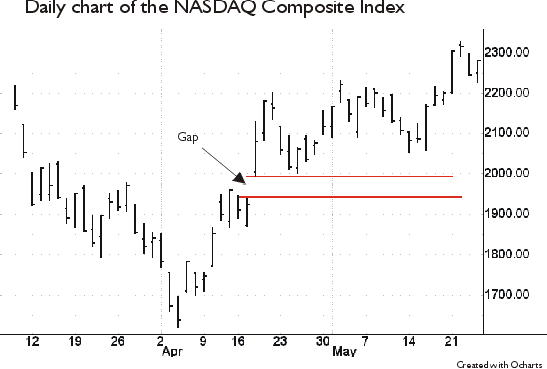
The daily chart of the NASDAQ Composite Index provides us with an example of how a
gap can turn into a nice support level.

Don’t be scared of gaps. They can give you profitable trading opportunities.
Till Friday,
Eddie
