GLD looks set to breakout
The stock market concluded last week with a well-deserved rest, as each of The bright spot of last Friday’s action was that the losses occurred on The culprit of last Friday’s afternoon selloff was a rapid reversal in the Since Friday was the first losing day in the S&P 500 in the past eight Finally, don’t forget about gold and, more specifically, the StreetTRACKS Open ETF positions: Deron Wagner is the head trader of Morpheus Capital Hedge Fund
the major indices corrected firmly off their highs. After starting the session
in the red, stocks attempted to recover throughout the morning, but a wave of
selling in the early afternoon caused the market to reverse back down and
subsequently break its morning lows. The Nasdaq Composite and S&P 500 fell
1.2% and 0.9% respectively, while the Dow Jones Industrial Average fared better
with its 0.6% loss. The S&P Midcap 400 slid 1.2% and the small-cap Russell
2000 closed 1.3% lower. All of the major indices finished near their intraday
lows, which is likely to put a bit of pressure on today’s open.
lighter volume. Given the substantial losses, one might have expected to see a
surge in turnover, but that wasn’t the case. Total volume in the NYSE declined
by 10%, while volume in the Nasdaq was 7% lighter than the previous day’s level.
Because stocks fell on lower volume, we know that the correction was more the
result of the buyers drying up as opposed to heavy institutional selling. Since
more than half of the market’s average daily volume is driven by institutional
trading, it’s important to constantly be aware of what is happening “beneath the
hood” of the market, then trade in the same direction as the institutional
players.
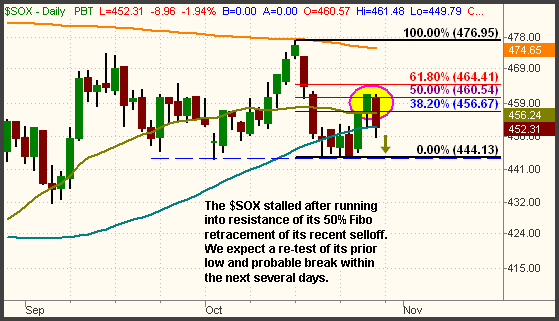
Semiconductor Index ($SOX), which began to lead the Nasdaq lower just after 1:00
pm. Ever since running into overhead resistance of its 200-day moving average on
October 16, the $SOX has been showing relative weakness to the market. Because
the $SOX often leads the Nasdaq, which in turn tends to lead the S&P, we’ve
been extensively analyzing the action in the index over the past several weeks.
On a technical level, last Friday’s poor performance in the $SOX was
significant, so let’s once again take a look:
On October 19, the $SOX index fell to key support of its prior low from
October 3, then clung to that level through October 24. On October 25, the $SOX
popped back above its 50-day MA, but we pointed out that a retracement of more
than 50% of its loss was necessary in order for the index to have a good chance
of rallying back to its high. Not surprisingly, the $SOX tested resistance of
its 50% Fibonacci retracement level on October 26, but that resistance is the
reason the $SOX fell the following day, last Friday. If the index fails to
quickly rally back above its October 26 high, the new “lower high” in the $SOX
will likely cause it to break down to new lows on its next move down. Per an
intraday e-mail alert to subscribers in the afternoon, we initiated a new short
position in the Semiconductor HOLDR
(
SMH |
Quote |
Chart |
News |
PowerRating). Assuming the relative weakness
continues, SMH will soon break its prior low.
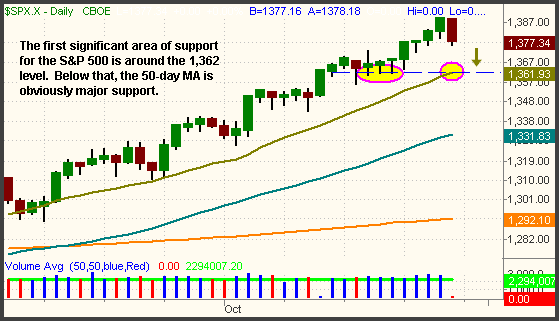
sessions, it could easily fall much lower and still be trading above the lower
channel support of its primary uptrend. With a short-term correction apparently
starting, let’s take a look at where the S&P and Nasdaq are likely to find
support that could provide a buying opportunity. We’ll start with the
well-diversified S&P 500 index:
The dashed horizontal line on the chart above marks the first area of
substantial price support on the S&P 500. Support is found in the 1,362 area
through to convergence of the 20-day moving average with the range of the lows
from two weeks ago. At the very least, we expect to see a correction down to
this level. Upon doing so, we will re-assess its price action in order to
determine whether or not the index is likely to make another leg lower. If not,
we may “dip a toe in the water” by looking to buy the ETFs with the most
relative strength. But if the S&P fails to hold at 1,362 support, the 50-day
moving average, presently at 1,331, will act as even greater support to catch
it. Next, take a look at the Nasdaq Composite:
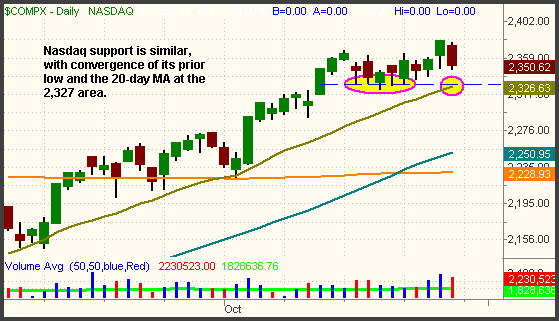
Although not picture on the daily chart above, last Friday’s slide in the
Nasdaq came only day after the index managed to close at a fresh multi-year
high. If the index in unable to recover back above last week’s high, we will
have the start of a classic “double top” chart formation. As for support, the
Nasdaq has a similar pattern to the S&P. Its 20-day moving average converges
with last week’s low, which should provide support at the 2,326 area. Below
that, the 50-day moving average resides all the way down at 2,250. As always,
keep a close eye on the daily price action of the $SOX in order to predict the
Nasdaq’s next move.
Gold Trust
(
GLD |
Quote |
Chart |
News |
PowerRating). It closed last Friday above its 50-day moving average for the
first time since early September and is only a hair away from breaking out above
its 200-day MA as well. Recall that such a breakout will also result in GLD
setting a “higher high” and moving above its five-month downtrend line. In the
pre-market, the spot gold commodity is presently trading higher by $5 per ounce.
If it holds, this will translate into an opening gap that puts GLD just above
its 200-day MA. We remain long our partial position from the October 25 entry,
and still plan to buy more shares on confirmation of the breakout.
Long GLD and
OIH, short SMH (regular subscribers to href=”https://www.morpheustrading.com/services.htm”
target=”New Browser Window (target=” _new?)?>The Wagner Daily receive
detailed stop and target prices on open positions and detailed setup information
on new ETF trade entry prices. Intraday e-mail alerts are also sent as needed.)
and founder of Morpheus Trading Group (href=”https://morpheustrading.com”>morpheustrading.com), which he launched in
2001. Wagner appears on his best-selling video, Sector Trading Strategies
(Marketplace Books, June 2002), and is co-author of both The Long-Term Day
Trader (Career Press, April 2000) and The After-Hours Trader (McGraw
Hill, August 2000). Past television appearances include CNBC, ABC, and Yahoo!
FinanceVision. He is also a frequent guest speaker at various trading and
financial conferences around the world. For a free trial to the full version of The Wagner Daily or to learn about Deron’s other services, visit
href=”https://morpheustrading.com”>morpheustrading.com or send an e-mail to
deron@morpheustrading.com
.
