Gold Shining Bright?
I’m not trying
to be a “wet blanket” on a strong sector, but I have to point out some key chart
observations as it relates to Gold. There is a confluence of factors coming
in that look to be putting pressure on this Futures contract
(
GC03G |
Quote |
Chart |
News |
PowerRating):
- Fibonacci price resistance
zone from 335.44-342.75 (9 levels)
- Two, count ’em, two Bearish patterns completing into our Fibonacci price
resistance zone. Two Bearish Butterflies. I’ve outlined them in the chart
below.
- Time & price symmetry”
a. The rally from August 1 to Sept. 24 was 36 days and 29 points. The
current rally from Oct. 24 to Dec. 13 is at 34 days and 27 points.
Similarity of this kind typically leads to at least a short-term reversal.

I’m taking
profits on unhedged gold stocks at this point. And, at these levels, I’m starting
to look for short opportunities whether it be in the commodity itself or the
unhedged gold stocks like Goldfields
(
GFI |
Quote |
Chart |
News |
PowerRating)
or Harmony
(
HMY |
Quote |
Chart |
News |
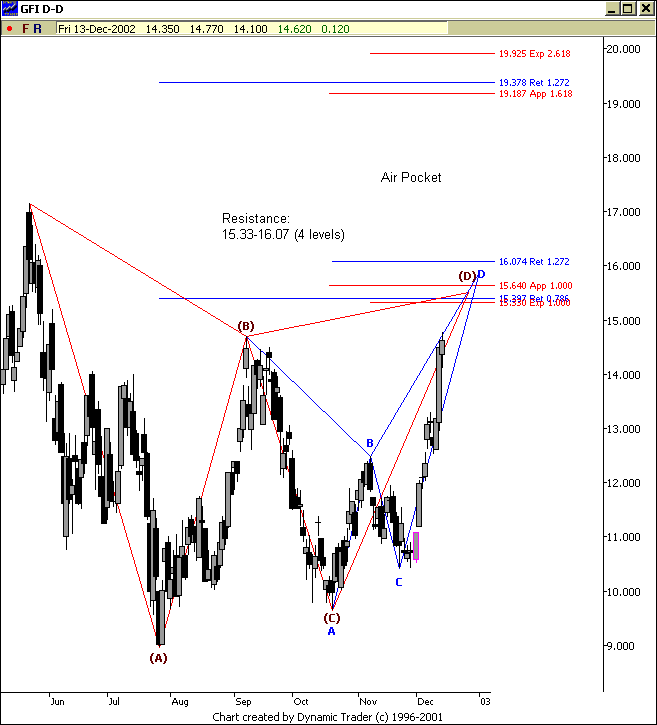
PowerRating). In fact, below is a chart that
also is ready to hit price resistance and forming a bearish pattern:

Similar situation
with
(
HMY |
Quote |
Chart |
News |
PowerRating)…two pattern completing into a resistance zone. So, longs may want to
be cautious here.
Now, the flipside
to GFI as well as the commodity is if we can clear the immediate resistance
defined in each of these charts. If that happens, there are big air pockets without
Fibonacci resistance levels. So, if immediate resistance is broken up, then this
rally could experience more velocity to the upside. The price decisions are
in place. Now we sit back and wait for this yellow metal to respond.
Have a great
weekend.
