Good News/Bad News
A much
better day for traders yesterday
as there was a good Trap Door contra rally in the Nasdaq 100
(
NDX |
Quote |
Chart |
News |
PowerRating) after a
gap down opening, and then the afternoon trend was down from the intraday high
of 1717 on the 10:45 a.m. bar to the Double Bottom at 1684 on the 3:00 p.m. bar,
before it closed at 1696.37. The S&P 500
(
SPX |
Quote |
Chart |
News |
PowerRating)Â had the same two trends, but the afternoon down trend was not as
strong as the NDX. The SPX found some support and churning at the familiar .50
retracement level of 1200, closing at 1204.40.Â
The SPX +0.3%, the Dow
+0.6% and NYA +0.4% all diverged positively from the Nasdaq 100
(
NDX |
Quote |
Chart |
News |
PowerRating) which
was -0.4%. Volume on the NYSE
picked up some to 979 million with a volume ratio of 54 and breadth was
positive. The Nasdaq volume picked up also, but just to 1.3 billion which is
about 70% of its average volume. Breadth was slightly negative at -203.
I try to include a snapshot
of market dynamics each day to better help you recognize pending changes or
divergences. Re-read my August
2 and August
3 text on the anticipation of a Change in Direction, as the SOX traded into
its 1661 200-day EMA and gave us early warning signs like rising prices on
declining volume and a narrow-range bar into the 200-day EMA after seven
straight rally days of higher highs and lows.Â
We had gotten in on a
reversal buy entry pattern right at the .618 retracement level which was in
convergence with an RST buy pattern — for those of you that have learned that
pattern. Our entry recognition was prior to the Merrill Lynch upgrade and our
exit was prior to Smith Barney’s and Lehman’s noise on Monday. (Anticipation
by recognizing early signs of Change in Direction and the shifting buying or
selling pressure — it wasn’t by reacting after the fact and following the
news.)Â
I see where
(
INTC |
Quote |
Chart |
News |
PowerRating)
finished yesterday at 30.62 up on the day, above the midpoint and an outside bar
close. The expected sellers didn’t show up. Maybe it’s because there has been so
much good news/bad news crystal balls from semiconductor chairmen and analysts
that paranoia has set in. Yesterday the semi equipment stocks got clipped more
than the rest of the semi litter due to
(
AMAT |
Quote |
Chart |
News |
PowerRating)‘s chairman’s negative
crystal ball. Yesterday was the third pullback day for semis and you don’t have
a clue whether there will be a 1,2,3 bottom and continuation up or whether there
will be a further retracement to at least the .786 level around 39 using the
SMHs. We will be ready.
We will watch for the
Change in Direction signs at the obvious pullback levels like, for example, a
(
KLAC |
Quote |
Chart |
News |
PowerRating)
at 52, where it broke out of its consolidation and above all of its EMAs, then
at 51 which is the rising 100-day EMA and just inside the breakout pattern. The
rising 200-day EMA is down at 48.54. The
.50 retracement to the recent swingpoint low of 45 is 52.35 and the .618 is
right on the 100-day EMA. You do have convergence. There
is no need to speculate or guess. Just be aware of the key levels and watch for
any Change of Direction signals.
I have included a daily
chart of the SOX below which highlights the five moves since the April lows.
There has been over 200% of movement for the five roundtrips so it pays you to
be all over this sector on a daily basis so as to capture just a portion of that
volatility. Intraday plays both
ways in many of the semis are a daily occurrence.
|
(September
|
||
|
Fair Value
|
Buy
|
Sell
|
|
3.60
|
 4.70  |
|
Stocks
Today
Early red, just as
yesterday morning. In the semis, stay involved both ways in the following semis:
(
NVLS |
Quote |
Chart |
News |
PowerRating),
(
KLAC |
Quote |
Chart |
News |
PowerRating),
(
AMAT |
Quote |
Chart |
News |
PowerRating),
(
NVDA |
Quote |
Chart |
News |
PowerRating) (which is churning at the
.618 to .786 zone which is 88 to 93),
(
IDTI |
Quote |
Chart |
News |
PowerRating) and
(
ELNT |
Quote |
Chart |
News |
PowerRating) which both set
up on the daily chart.Â
Also
(
MU |
Quote |
Chart |
News |
PowerRating),
(
MCHP |
Quote |
Chart |
News |
PowerRating),
(
RFMD |
Quote |
Chart |
News |
PowerRating),
(
BRCM |
Quote |
Chart |
News |
PowerRating) and also the SMHs.
Other daily chart setups
are
(
BMET |
Quote |
Chart |
News |
PowerRating),
(
CHV |
Quote |
Chart |
News |
PowerRating),Â
(
BGP |
Quote |
Chart |
News |
PowerRating),
(
FITB |
Quote |
Chart |
News |
PowerRating),
(
FNM |
Quote |
Chart |
News |
PowerRating),
(
ELN |
Quote |
Chart |
News |
PowerRating),
(
FRX |
Quote |
Chart |
News |
PowerRating),
(
BAX |
Quote |
Chart |
News |
PowerRating),
(
WPI |
Quote |
Chart |
News |
PowerRating),
(
HOTT |
Quote |
Chart |
News |
PowerRating),
(
CAT |
Quote |
Chart |
News |
PowerRating),
(
IMCL |
Quote |
Chart |
News |
PowerRating) and
(
AMGN |
Quote |
Chart |
News |
PowerRating).
On the short side, if the
red stays and persists, look at
(
MERQ |
Quote |
Chart |
News |
PowerRating),
(
CHKP |
Quote |
Chart |
News |
PowerRating),
(
SEBL |
Quote |
Chart |
News |
PowerRating) and
(
VRTS |
Quote |
Chart |
News |
PowerRating).
Have a good trading day.
Keep the helmets on — we’re going to get a good little pop in here either today
or tomorrow.
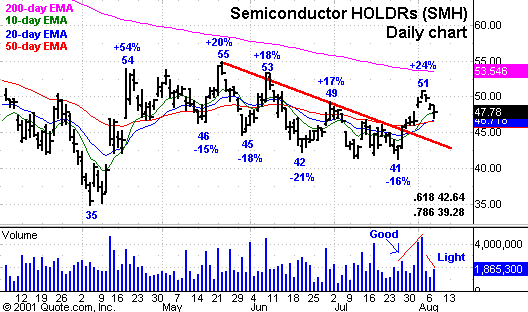
Daily chart of
Semiconductor HOLDRs (SMH) with 10-, 20-,
50- and 200-period
EMAs
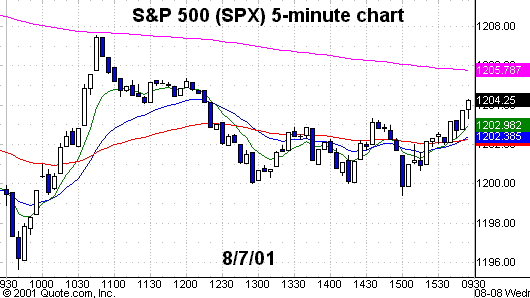
Five-minute chart of
Tuesday’s S&P 500 with 8-, 20-,
60- and 260-period
EMAs
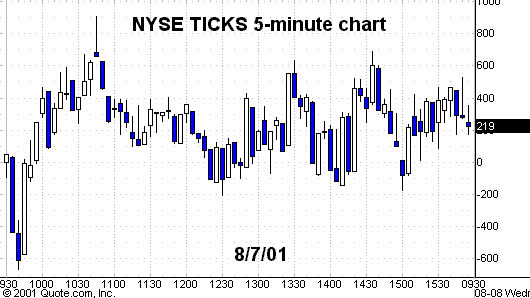
Five-minute chart of
Tuesday’s NYSE TICKS
Do you have a follow-up question about something in this column or other questions about trading stocks, futures, options or funds? Let our expert contributors provide answers in the TradingMarkets Trading Advisor! E-mail your question to questions@tradingmarkets.com.
For the latest answers to subscriber questions, check out the Q&A section, linked at the bottom-right section of the TradingMarkets.com home page.