Good opportunities in this sector
Kevin Haggerty is a full-time professional trader who was
head of trading for Fidelity Capital Markets for seven years. Would you like
Kevin to alert you of opportunities in stocks, the SPYs, QQQQs (and
more) for the next day’s trading?
Click here for a free one-week trial to Kevin Haggerty’s Professional
Trading Service or call 888-484-8220 ext. 1.Â
The volatility picked up
into the 2/14 – 2/17 time period and there was also an option
expiration on Friday. The SPX closed just 1.6% on the week to 1287.24, Dow +1.8%
to 11,115, QQQQ +0.6% to 41.21 and the Nasdaq, +0.9%. Fewer stocks are pushing
the major indexes higher and there is a continued emphasis on the blue chips.
Technology fell off as both the Nasdaq and QQQQ underperformed the SPX and Dow.
This seems to bother classical technical analysts, but yet they can’t tell you
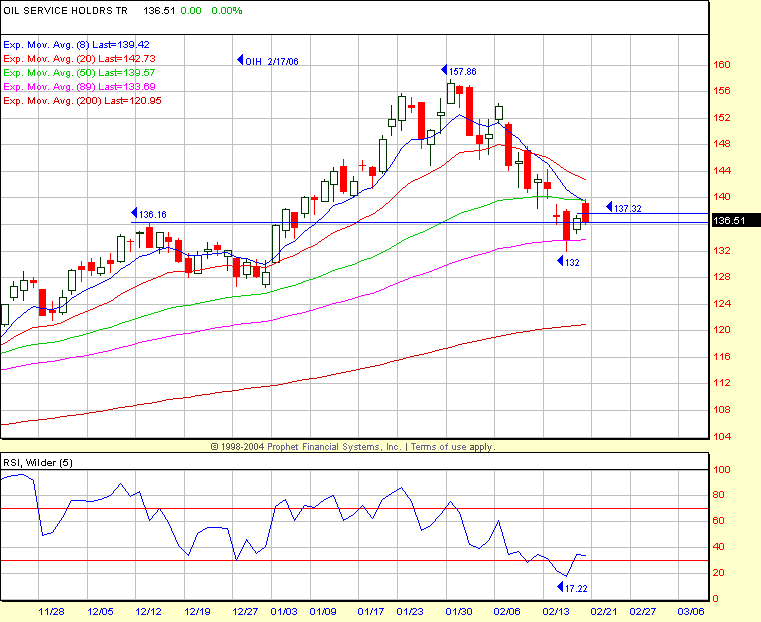
how to make money with it. The energy stocks and semiconductors finished the
week red with the OIH -4.3% and SMH -0.6%.
NYSE volume dropped off on Friday to 1.56 billion
shares, volume ratio neutral at 51 and breadth +424. The major indices have
rallied three straight days before the SPX finished -0.2% on Friday. This time
period rally last week pushed the 4 MA VR to 66 and breadth +959, both in ST-OB
overbought territory. The Dow is the most extended of the major indices and I’m
sure all of you RST traders are on the case. The rally last week was positive
from a volume standpoint, with the up volume/down volume ratio positive at 1.56.
The rally puts February on the green side vs. the 01/06 SPX close of 1280.05 and
the SPX is +3.1% YTD. I expect the Generals will try to close February (6 more
trading days) as best they can. However, “Beware the Ides of March” on a rally
through month-end into mid-March.
Energy and commodity-related stocks will continue
to provide day traders with the most opportunities because of their volatility
and the herd mentality chasing these commodity-related stocks. The
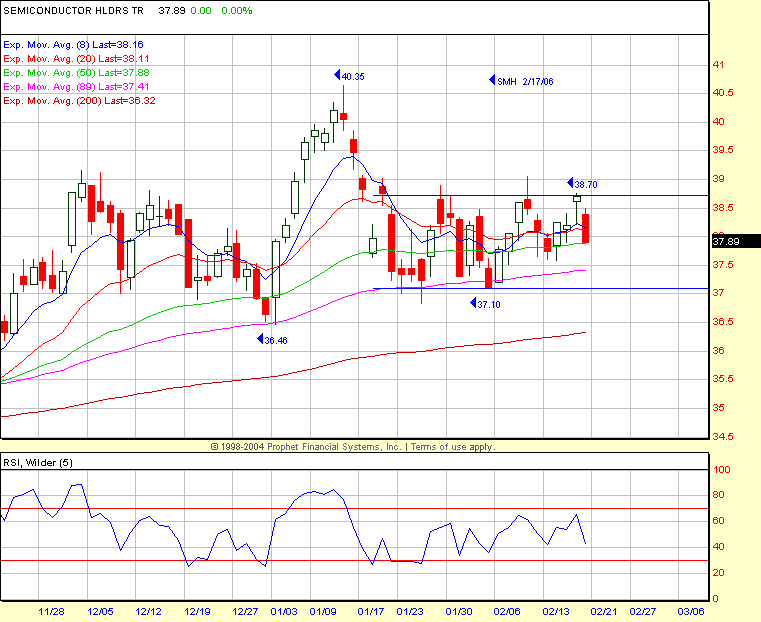
semiconductors are very choppy with the SMH in a high/low closing range of 38.70
– 37.10 since 01/20/06. The $SOX has a much better-looking chart but that is
only because of BRCM and MRVL, which are not components of the SMH HOLDR. The
intraday reactions in both directions get extended in the semiconductors so
there are some good opportunities despite the range-bound SMH.
Have a good trading day,
Kevin Haggerty


