Haggerty: Anatomy of a Swing Trade
From 1990 to 1997, Kevin Haggerty served as Senior Vice President for Equity Trading at Fidelity Capital Markets, Boston, a division of Fidelity Investments. He was responsible for all U.S. institutional Listed, OTC and Option trading in addition to all major Exchange Floor Executions. For a free trial to Kevin’s Daily Trading Report, please click here.
As 2009 winds down the SPX has remained in a narrow trading range since Nov 10th, with extremely low volatility and light NYSE volume. Day traders can benefit from the range trading, but it is difficult for swing traders.
However, not everything has been trading in a narrow range, as evidenced by the pullback from the highs in the energy sector. Crude oil has declined -14.9% from its 10/21 82 high to a 69.81 intraday low (12/10) and close at the 70.58 200DEMA. It hit an intraday high yesterday of 72.54 before closing at 71.86.
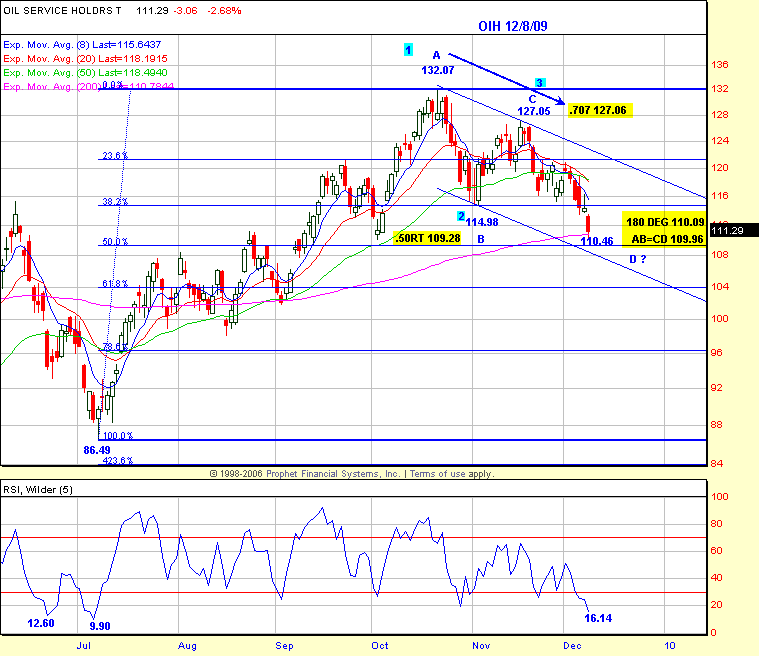
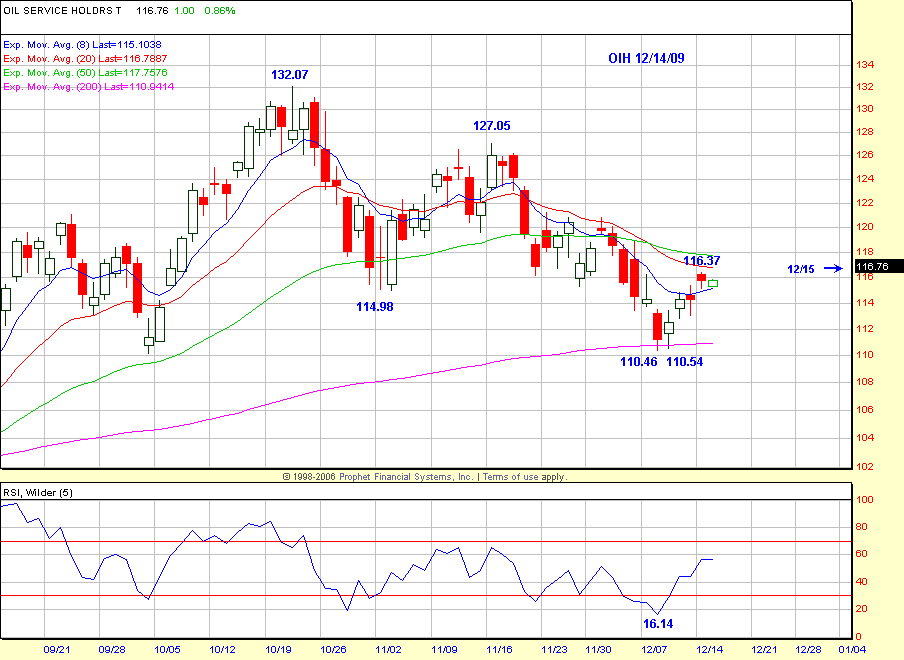
In the Trading Service all key price and time zones are anticipated in advance for potential swing trades, and the most recent one is the OIH which hit its key zone on 12/8 with a 110.46 low, and bounced +5.4% in 4 days to 116.37 and closed yesterday at 115.74.

The OIH has pulled back from the 132.07 cycle high to the rising 200DEMA, and this is called the “Generals Pullback” as those of you that have my trading modules are aware of. In order to qualify, it has to be a pullback to the 200DEMA from the previous actual rally high.

Once the OIH traded below 114.98 it became a confirmed 123 Lower Top pattern, and also a Parallel Line pattern (AB=CD), which helps determine key price zone symmetry. In this case AB=CD at 109.96, and although it is not marked on the chart, 110 is the 1.414 Fib extension of the BC leg up. The 200DEMA was 110.78 that day and the 180 Degree angle measured from 132.07 is 110.09, with the .50RT to 86.49 from 132.07 at 109.28 In addition to the symmetry the OIH and crude oil were S/T O/S on a momentum basis which confirmed the decision to take a swing trade.
Traders got intraday pattern entry setups on both 12/8, and also 12/9 after a 110.57 low. Because it is a key zone, when you take a day trade and it has a profit cushion at the end of the day, you can carry it over as your initial swing trade position, which was the case in this situation for members of the Trading Service that were ready to act in the key price zone.
This strategy and many more can be seen in action by taking a free trial to the Trading Service.
Have a good trading day!
Click here to find full details on Kevin’s courses including Trading with the Generals with over 20 hours of professional market strategies. Plus a free trial to Kevin’s daily trading service.
