Haggerty: The RST Strategy Week
From 1990 to 1997, Kevin Haggerty served as Senior Vice President for Equity Trading at Fidelity Capital Markets, Boston, a division of Fidelity Investments. He was responsible for all U.S. institutional Listed, OTC and Option trading in addition to all major Exchange Floor Executions. For a free trial to Kevin’s Daily Trading Report, please click here.
The SPX has closed within the 1113.69-1084.90 range for 19 days with intraday highs and lows at 1119.32 and 1084.90. The SPX has been churning in the key 1121 price zone which is the .50RT to the 1576 10/11/07 bull market top. It is also the 1.27s Fib extension of the last leg down from 1101.36 (10/21) to 1029.38 (11/2) and it is also the 360 degree angle from the 869.32 low (7/8).
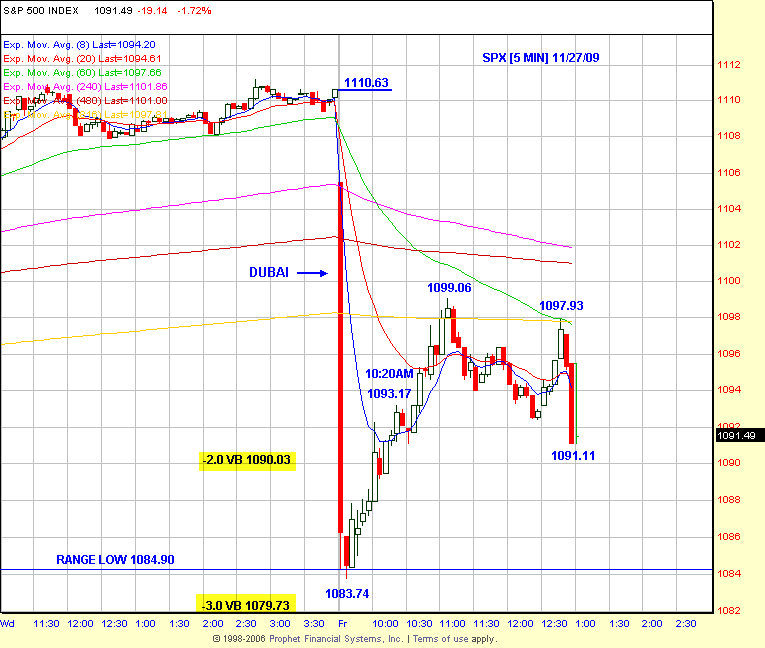
There is no surprise that the market is churning here, but there has been enough trading volatility within the range for daytraders to make significant gains on my extended volatility strategies. The first SPX chart is the Dubai fiasco (11/27) that precipitated a rush to unwind the “carry trade” by selling equities and commodities, and covering shorts in the $USD.

The SPX made a 1083.74 low on the 9:35AM bar, versus the range low of 1084.90, but more importantly, it was extended to almost the -3.0 volatility band, which has better than a 99% probably for a mean reversion, and a profitable contra move for daytraders. The SPY actually hit its -3.0 band right on the money with a 108.29 low and 108.31 -3.0 VB, followed by the significant contra move, so daytraders made significant gains.
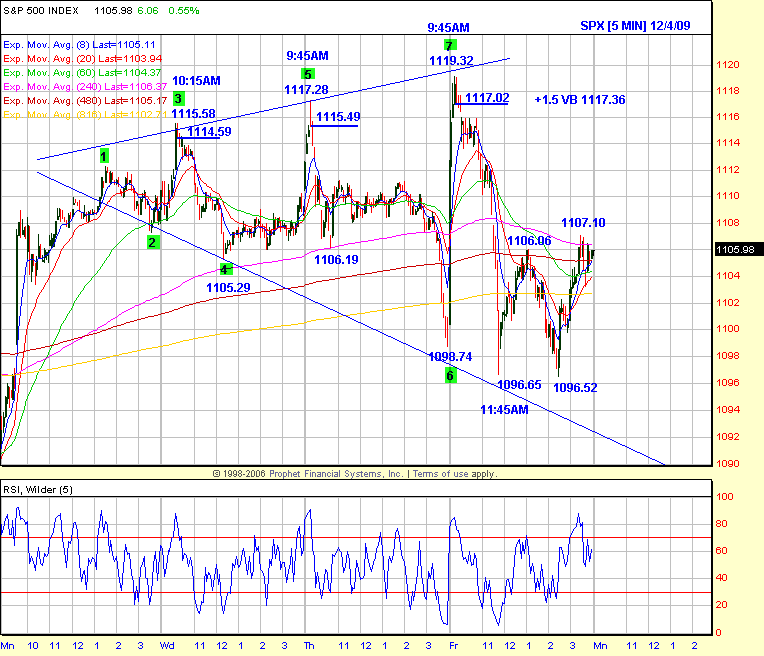
This Dubai trade was covered in the previous commentary, but it is important when viewed in the context of the excellent trading volatility for the rest of the week through last Friday (12/4), it was all about the RST reversal strategy last week from Wed-Fri, and members of the Trading Service had a big week.

The initial RST entry on Wednesday was below 1114.59 that declined to 1105.29, and the next RST on Thrusday had an entry below 1115.49 that declined to 1098.74. For those of you that have my trading modules and are familiar with the RST strategy you will notice that I didn’t label the 5 points for the first two RSTs, and that is only because on Friday we got the big 7 point RST after the 1119.32 high on the 9:45AM bar because of the “jobs nonsense” hype, and I wanted to make sure you saw the symmetry for all 7 points. The entry below 1117.02 and the +1.5 volatility band at 1117.36 declined to 1096.65 before reversing to 1106.06 (yes, it was the 8 point), so there were many happy daytraders last week.
Bernanke reiterated the Fed’s low interest policy and sluggish recovery scenario yesterday, and now the non credible jobs report is history as the SPX is trading at 1090.67 as I complete this at 9:40AM. However, if it sells off to at least the 1078 50DEMA zone this week look for buyers to show up to play the seasonal bias into year end.
Have a good trading day!
Click here to find full details on Kevin’s courses including Trading with the Generals with over 20 hours of professional market strategies. Plus a free trial to Kevin’s daily trading service.
