Has trading got tougher lately? Let’s find out…
Before I present some eye-opening findings, allow me to propose a thesis:
Every market has its personality, and that personality is defined by two
traits: Volatility and Trendiness. A volatile market is one that
moves a great deal from time period to time period. A trendy market is one
that tends to move in the same direction from one period to the next. Over
time, markets change their personalities, which is to say they change their
volatility and trending. This is part of what makes markets so difficult
to trade: just as traders adapt to one market personality, another is likely to
take its place.
What we’ve seen in recent years in the S&P 500, however, is a personality
change worthy of Jekyll and Hyde. I believe this accounts for the common
perception among retail and professional traders alike that the recent period
has been one of the most difficult on record to trade.
In fact, I can prove it.
For my investigation, I went back to January, 1934. I looked at two
time periods in the Dow Jones Industrial Average: hourly (the first hour
of the day) and daily and measured their volatility and trendiness. Both
of these were measured as a 500 day moving average, which covers roughly two
years of trading. Hourly volatility was measured as the absolute values of
the price changes from the close of the previous day to the close of the first
hour of the current day. I used first hour data only, since this is
commonly the most volatile intraday period. Daily volatility also looked
at the absolute value of price changes from the close of the prior day to the
close of the current day.
To assess trendiness, I followed the methodology of my recent article.
I examined the number of occasions in a moving 500 day period in which rising
first hours (days) were preceded by rising last hours (days) or falling first hours (days) were
preceded by falling last hours (days). Recall that, if we assume that the odds
of a rise or decline are 50/50, we should average about 250 occasions out of 500
where a rise or decline continues into the next period.
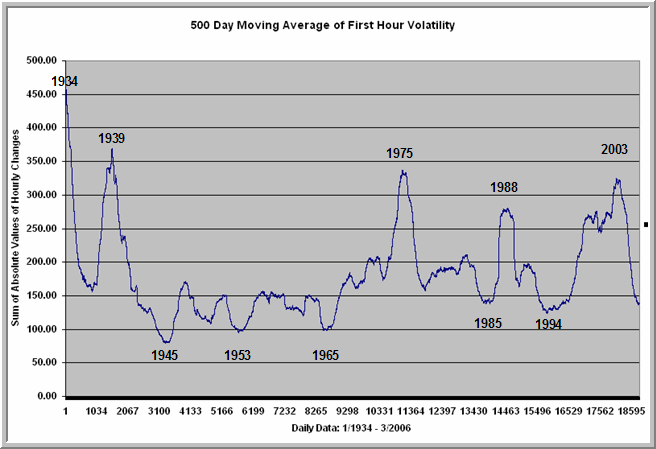
First we’ll start with volatility. Here is the chart for hourly
volatility:
Now here is the chart for daily volatility:

As you can see, for all practical purposes they are
identical. They show us three things:
1) current volatility has
dropped considerably from the 2003 peak;
2) by historical standards today’s
volatility is below average, but not historically unusual; and
3) periods of low
volatility can persist for considerable periods of time. Indeed,
volatility could drop further and we still would not be at historic lows.
Now let’s look at trendiness at an hourly level:
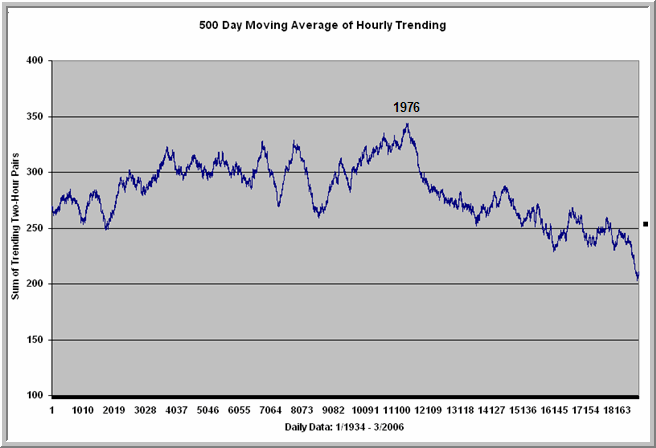
This absolutely floored me when I saw it. Notice that we
were above the 250 level consistently from 1934 to 1976. Since 1976,
however, the trending quality of the first hour has gone steadily downhill, to
the point where we’re now well below 250 at historic lows. For the
first time in market history, this suggests, we are now *more* likely to fall in
the first hour if the last hour of the prior day is up and vice versa.
This hourly pattern fits with the intraday studies on my
research site.
How about trendiness on a daily basis?
 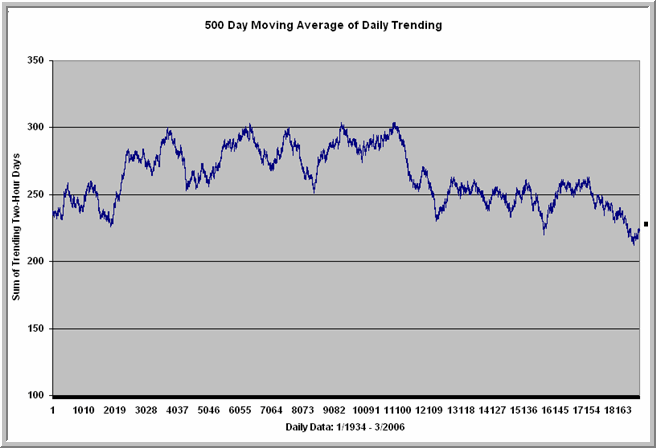
Once again, we see a very similar pattern. In the
mid-1930s we saw some values below 250, but after that, up days were more likely
to be followed by up days and down days by down days. This changed
starting after 1976, and now we have been below 250 rather consistently.
Instead of trending, markets are tending to reverse the direction of their prior
period.
So let’s put these findings together: We are seeing
reduced volatility *and* we are seeing reduced trendiness. That means that
traders are able to take less movement out of trades *and* they are less likely
to see movement carry over from one period to the next. Is it any wonder
that traders are experiencing such difficulty? We have never seen a market
personality quite like this one, in which low volatility has also been
accompanied by low trending.
But now the bad news. I’ve also performed historical
studies of trendiness on a five-minute basis (reported on my research
site). The proportion of trending occasions is nowhere near even the
one-half level; it’s more like one-third. That is because of the low
volatility: a third of the time the market doesn’t move at all (price stays
constant) and another third of the time the market reverses. The
short-term momentum trader is thus in the worst of all possible worlds, as low
volatility produces a lack of movement and low trending produces a lack of
follow-through on moves.
I believe traders–especially short-term traders of the stock
indices–need to take these findings very seriously. To the extent that
the loss of trending is created by increased arbitrage and program trading,
there is no assurance that it will reverse. Moreover, we’ve seen that the
loss of volatility in the market can also persist–and even get worse. To
blindly hope that the market will “get better” is not a trading plan,
much less the plan for a trading career.
The good news is that there are trading instruments with far
higher levels of volatility and trendiness, and those include many individual
stocks. (One look at this is on the Trader
Performance page of my personal site). Note that this makes
stock picking and portfolio selection more important than ever. There aren’t any universal
laws in trading, but this one might come close:
Make sure the
personality of what you trade fits with how you trade.
Brett N. Steenbarger, Ph.D. is Associate Clinical
Professor of Psychiatry and Behavioral Sciences at SUNY Upstate Medical
University in Syracuse, NY and author of The
Psychology of Trading (Wiley, 2003). As Director of Trader Development
for Kingstree Trading, LLC in Chicago, he has mentored numerous professional
traders and coordinated a training program for traders. An active trader of the
stock indexes, Brett utilizes statistically-based pattern recognition for
intraday trading. Brett does not offer commercial services to traders, but
maintains an archive of articles and a trading blog at www.brettsteenbarger.com
and a blog of market analytics at www.traderfeed.blogspot.com.
He is currently writing a book on the topics of trader development and the
enhancement of trader performance due for publication this fall (Wiley).