Heads Up
Yesterday
was just plain ugly for the
market but good for the traders. The Dow, with the Basic leading, actually still
managed to finish positive at +0.5% as did the New York Composite at +0.3%. The
Tech Wreck, led by the the Nasdaq 100
(
NDX |
Quote |
Chart |
News |
PowerRating), closed at 1424 or -3.1% and the
S&P 500
(
SPX |
Quote |
Chart |
News |
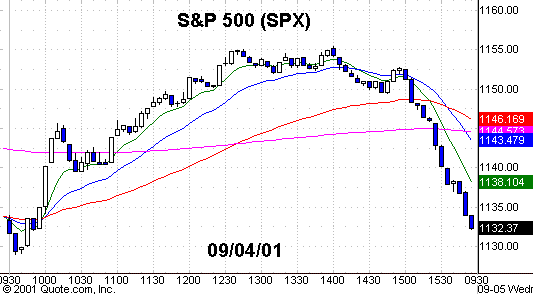
PowerRating) — which was buffeted by afternoon sell programs and
trader bale outs, closed at 1132.94, right back to where it started on an
Opening Reversal from the .786 retracement zone of 1131.
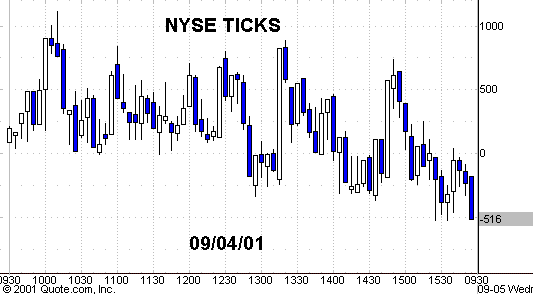
If you look at the NYSE
Tick chart from yesterday, you will see the ticks went from +739 just before
3:00 p.m. ET to -532, as the sell programs accelerated on the 3:05 p.m. bar and
right into the market on close. The programs stand out when you see that the SPX
had a volume ratio of 34 vs. the NYSE volume ratio of 50. Both the NYSE and SPX
traded about 5%-10% above their average volume, while the Dow traded +20% above
its average.
Prior to that NAPM report,
we had already seen the leading economic indicators advance for the fourth
successive period. Institutions don’t just rush in screaming to buy stock on the
Purchasing Managers’ report, but it’s a great spot to squeeze shorts and for the
program mafia to leg a trade from the long side. The
Nasdaq Composite
(
COMPX |
Quote |
Chart |
News |
PowerRating) closed at 1771, -1.9% on the day, and a volume
ratio of just 22.
(
HWP |
Quote |
Chart |
News |
PowerRating) and
(
CPQ |
Quote |
Chart |
News |
PowerRating) did nothing, as it’s probably
perceived as two dogs getting together, with no improvement. I would expect to
see the same in the Telecommunications area because it’s either that or Chapter
11 like the dot-coms.
The Semis, closing down
-3.4% as per the
(
$SOX.X |
Quote |
Chart |
News |
PowerRating) are in a show-or-tell technical position. The
(
$SMH.X |
Quote |
Chart |
News |
PowerRating)s closed at 42.16 which is right at the .618 retracement zone but
also at the neck of a head-and-shoulders pattern below all its moving averages.
The SMH volume was significant at 2.9 million which is the most since the 8/8
wide-range-bar down. Classic techies will be all over the head-and-shoulder
pattern and the downside break could take the SMHs right down to the .786 level
at 39.11. Whatever the Generals
decide to do is great for traders because the SMHs are right at a key inflection
point and also a significant retracement alert zone. You should definitely get
good intraday action either way, and my guess is both ways.
|
Program
|
||
|
Fair Value
|
Buy
|
Sell
|
|
1.40
|
 2.40 |
|
Stocks
Today
In the Semis (which, after
yesterday, set up as continuation shorts on the daily charts but any early down
on the Semis will probably give you some good Trap Door long plays for a quick
contra turn): Focus intraday on
(
KLAC |
Quote |
Chart |
News |
PowerRating) (which is the same
head-and-shoulders pattern as the SMHs),
(
NVLS |
Quote |
Chart |
News |
PowerRating),
(
BRCM |
Quote |
Chart |
News |
PowerRating),
(
AMAT |
Quote |
Chart |
News |
PowerRating),
(
NVDA |
Quote |
Chart |
News |
PowerRating),
(
TXN |
Quote |
Chart |
News |
PowerRating),
(
MU |
Quote |
Chart |
News |
PowerRating), and
(
RFMD |
Quote |
Chart |
News |
PowerRating).
Other stocks to look at if
they come back for the Basics:
(
WY |
Quote |
Chart |
News |
PowerRating),
(
GP |
Quote |
Chart |
News |
PowerRating),
(
AA |
Quote |
Chart |
News |
PowerRating) and
(
DOW |
Quote |
Chart |
News |
PowerRating). Also, in
the Medical area:
(
BAX |
Quote |
Chart |
News |
PowerRating) and
(
WLP |
Quote |
Chart |
News |
PowerRating). If
we turn red, the following stocks set up as daily chart continuation shorts:
(
VRSN |
Quote |
Chart |
News |
PowerRating),
(
VRTS |
Quote |
Chart |
News |
PowerRating),
(
MERQ |
Quote |
Chart |
News |
PowerRating) and
(
BRCD |
Quote |
Chart |
News |
PowerRating). My
guess is we get a reflex rally today or tomorrow into a high by 9/11, and then
we’re vulnerable for a quick good-size airpocket down.
Have a good trading day.
Â

Five-minute chart of
yesterday’s S&P 500 with 8-, 20-,
60- and 260-period
EMAs

Five-minute chart of
yesterday’s NYSE TICKS
Do you have a follow-up question about something in this column or other questions about trading stocks, futures, options or funds? Let our expert contributors provide answers in the TradingMarkets Trading Advisor! E-mail your question to questions@tradingmarkets.com.
For the latest answers to subscriber questions, check out the Q&A section, linked at the bottom-right section of the TradingMarkets.com home page.
