Hello, Japan?
After
the early red down opening, there
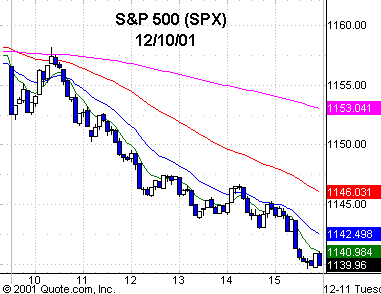
was the contra rally, but it was over by 10:20 and the trend was down for the
remainder of the session. There were pauses at some Fib extensions and at the
1144 .618 retracement to the 1125.78 SPX
(
$SPX.X |
Quote |
Chart |
News |
PowerRating) recent low, but no real
rally attempt. The early contra rally took the NDX
(
$NDX.X |
Quote |
Chart |
News |
PowerRating) from 1657 to
1694, which was a good move in the QQQs, before the downtrend sent it to a
1642.42 low, closing at 1645.45. The SPX opened down to 1152 on the second bar,
then a quick contra spurt to the previous close at 1158, but it ended there,
trading down to 1139.66, closing at 1139.93. The 20-day EMA is 1140.92 and
becomes the first upside pivot. That’s a 2.9% decline of 34 points from the .618
alert level of 1144, which is also the 200-day SMA, where once again there was a
reversal at a key alert zone.Â
The Nasdaq had traded
through its 1934-1950 resistance, including the 1942 200-day SMA, but couldn’t
close above its 200-day EMA at 2057, with the high close being 2054. It traded
at a 1990 intraday low yesterday, closing at 1992, or -1.4% on the day.
NYSE volume wasn’t big at
1.18 billion, but the volume ratio was just 22, with breadth a negative 1198.
The SPX ended -1.6%, and the NDX -1.7%. In the sectors, the
(
$BTK.X |
Quote |
Chart |
News |
PowerRating) was
-4.3%,
(
$SOX.X |
Quote |
Chart |
News |
PowerRating) -2.2%, while the basics, retail and financials were all
red.
The SPX closed at 1139.93
yesterday, and I read that Ned Davis Research reported that 73 of the last 100
Decembers have been positive, with a current win streak of five consecutive
years. That certainly puts us on alert for pullback position setups as the
indices come back to their moving averages and previous alert zones. We’ve got
12 1/2 more days for this to bear fruit.
For example, the BTK has
had a strong uptrend, and the past two days has taken the index from a
double-top high of 625 to a 575 close yesterday. A good buy setup zone should
come from the 562 50-day EMA to the 534 200 SMA zone. The 200-day EMA is 549.
I assume that after
seeing the Nasdaq run through its 200-day SMA, only to stop right at its 200-day
EMA and provide an excellent short opportunity, you will now make yourself aware
of all of the different alert zones and take the setup if it presents itself
with a tight stop which will give you a good reward to risk trade.
Another example is the
QQQs, which closed at 41 yesterday and is a pullback to the top of its recent
three-week trading base and right on its 200-day SMA of 40.88. The 200-day EMA
is down at 39.91. The 40.80 – 40.35 level is the stronger buy zone, assuming no
Greenspan-created downside gap. If I can get you thinking ahead each day and
preparing a plan at various alert zones, then I will have accomplished my
objective.Â
Stocks
Today
Greenspan this morning is
expected to cut again for the 11th time, which is the lowest rate since 1961. A
friend of mine and former economist that decided to get into the real world and
make money told me yesterday that Greenspan has no shot at keeping the fed funds
rate below the inflation rate and is essentially trapped, so he’ll be forced to
start raising rates in the near future. How good can things be with the Fed
continually dropping rates and the TV drones parading talking heads like Wayne
Angel this morning saying more to come? Hello, Japan? Let’s hope the Generals
maintain the positive perception, which is fragile, and can turn on a dime.
Stocks to look at today:
(
ABT |
Quote |
Chart |
News |
PowerRating),
(
BRL |
Quote |
Chart |
News |
PowerRating),
(
FRX |
Quote |
Chart |
News |
PowerRating),
(
QLGC |
Quote |
Chart |
News |
PowerRating),
(
YUM |
Quote |
Chart |
News |
PowerRating),
(
HOTT |
Quote |
Chart |
News |
PowerRating),
(
NVDA |
Quote |
Chart |
News |
PowerRating),
(
MERQ |
Quote |
Chart |
News |
PowerRating),
(
COST |
Quote |
Chart |
News |
PowerRating) and
(
LEH |
Quote |
Chart |
News |
PowerRating).Â
On the short side,
(
BGEN |
Quote |
Chart |
News |
PowerRating)
and
(
CHIR |
Quote |
Chart |
News |
PowerRating), and also, obviously if it turns, anything in the index proxies.
Have a good trading day.

Five-minute chart of
Monday’s SPX with 8-, 20-,
60- and 260-period
EMAs

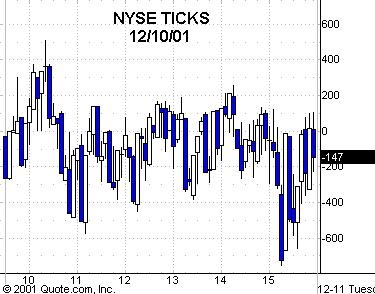
Five-minute chart of
Monday’s NYSE TICKS
|
Additional
Below are the tools that Kevin uses on the TradingMarkets
|
