Here are my 3 favorite PowerRatings strategies
Editor’s note: In this
in-depth article, 10-year professional day trader, John Emery shares his favorite
PowerRatings
trading strategies.
Ashton Dorkins
Editor-in-Chief
I have been a trader of
stocks and stock indexes for almost 10 years. I started trading as a
proprietary trader with a well-known proprietary firm. The adage of the lead
trainer at the time was “every ship at the bottom of the sea had a chart.â€
I was not very successful as a trader at the firm.
I and several other traders left and became involved with another proprietary
firm that believed in charts and indicators. This was better, but real success
still eluded me. A major breakthrough in my trading resulted from my exposure to
the early writings of
Don Miller.
Trend Analysis Using Multiple Time Frames is the backbone of my trading.
Here’s a further background before I go on. During a particularly quiet market period, I
had the good fortune to work with TradingMarkets.com as a sales consultant. So
my name may sound familiar to some of you.
Today I am making my living as a professional day trader. As a professional day
trader I use several of the tools, methods and strategies from TradingMarkets.
I use the products because they have provided me with a distinct edge in my
trading.
The first TradingMarkets product I ever used that provided a statistical
edge in my trading was the
RSI-25 Explosion
system. I remember being very skeptical of the whole concept of “statisticalâ€
trading, but I have become a believer.
Let me take a break here. If your eyes just glazed over or your attention span
drifted at the mention of the concept of “statistical†edge, you are
experiencing a normal reaction. Ninety-five percent of the traders I have talked
with about this concept “do not get it.” Frankly, neither did I at first.
But I watched, learned, and most importantly, profited.

For you to understand the potential of
PowerRatings,
you must understand the concept of “statistical†edge. Let me try to help you
understand the concept.
First, Las Vegas is built on a statistical edge. All those beautiful casinos
were built with the knowledge that if people gambled at the casino, almost all
would lose their money over a period of time. Occasionally someone will randomly
become a big winner. Of course if the big winner hangs around at the casino long
enough, the big winner will give it all back. This occurs because the house has
the edge in all the games. For every $100 wagered by a gambler, the house will
retain a known percentage over a period of time. The gambler will at times be
ahead, but over the long run, the gambler will lose.
There are two important distinctions to recognize when comparing trading to
gambling in a casino. The first distinction is that the markets are open. You
are not trading against the house. You are trading against other traders. The
second distinction is that you can develop your own statistical edge.
If you can develop a statistical edge, you will have a much better chance at
trading success.
I have spent a considerable amount of time, energy and money to develop my
statistical trading edge. It is derived from watching charts, understanding what
the other market participants are trying to do, and using tools and methods that
are quantifiable in terms of the edge they provide.
Larry Connors and the TradingMarkets research team have done this with
PowerRatings. His objective was to find the proper mix of patterns and
trading tools that produced a probable and predictable move. The team did
extensive research and back testing of over 10 years of historical data. The
result was a rating system than can be statistically quantified. A stock with a
PowerRating of 9 or 10 has been shown to rise in price over the next 5
days at a statistically higher rate than a stock rated at a lower number. A
stock with a PowerRating of 1 or 2 has been shown to fall in price over
the next 5 days at a statistically higher rate than a stock with a higher
number.
Does this mean that this stock is guaranteed to go up? Absolutely not! Does this
mean that a stock rated lower might not rise? Again Absolutely not! What this
does mean is that a stock with a high PowerRating has what I call a “predispositionâ€
to rise. A stock with a low number has a “predisposition†to fall.
Let me stress again, there is no guarantee in the direction of a stock price as
the result of a particular PowerRatings Number. It is a probability. This
probability can be translated into a higher success rate. So far, I have had a
very high success rate when trading stocks with this “predispositionâ€.
How do I use this knowledge? I like to trade high volume, big cap stocks. At the
end of the trading day, I scan the 8, 9, & 10 ratings for stock symbols I
recognize. With over 6000 stocks being scanned, I see many symbols that I am not
familiar with. I tend to ignore the symbols I do not recognize because they do
not match my trading style. When I see a stock I recognize with an 8, 9 or 10, I
do further research to see what type of pattern the stock is in. I check to see
if there are earnings announcements on the horizon. I check the sector to see if
other stocks are in similar patterns. Usually the stock goes on my trading watch
list for the next day. I also scan the 1, 2, and 3’s and review them the same
way.
There are 3 recent trades from PowerRatings that I would like to share.
These trades came in Toll Brothers
(
TOL |
Quote |
Chart |
News |
PowerRating), SanDisk
(
SNDK |
Quote |
Chart |
News |
PowerRating), and
Southwestern Energy
(
SWN |
Quote |
Chart |
News |
PowerRating).
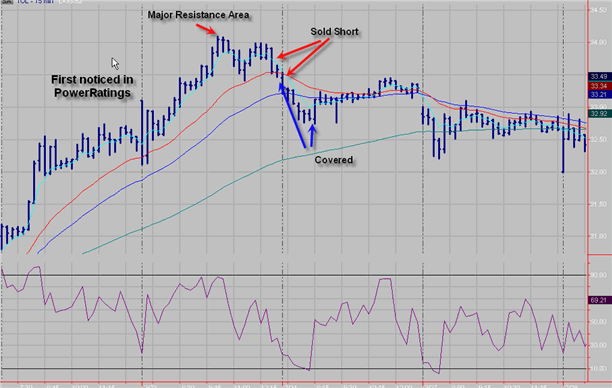
TOL came up on February 21, 2006 with a rating of 2. Upon doing further research
I found that TOL had an earnings announcement the next morning. I make a habit
of not having a position going into an earnings announcement. I have saved
myself lots of money with this rule. I put the stock on my watch list and posted
the fellow housing stocks on my watch list. While I did not trade TOL early in
the day, I traded several other housing stocks from the short side that morning
as the reversal patterns set up. TOL rallied during the opening 2 hours and then
rallied during the doldrums. I had noticed a major resistance area around the 34
price area. The resistance went back into November. I became very interested in
a possible short of TOL as it started exhibiting an inability to break through
the 34 area. I took a short term short trade prior to the close and covered for
a profit. It was definitely on my watch list for the next morning.

The next morning, based the intraday pattern and
the continuing PowerRating, I decided to go short on the open.
Fortunately TOL is exempt from the uptick rule and I was filled on the opening
print. The stock dropped like a rock right into a support area where I covered.
I traded TOL several more times that day, all for small profits.
SNDK was another PowerRatings pick on February 21, 2006, with a
PowerRating of 9. The stock had been a downtrend for 13 days. 13 is a
Fibonacci number and SNDK seems to follow Fibonacci cycles in its moves I felt
that the probabilities for a rally were very good. If it started to rally, the
short covering action alone would push the price up.
I purchased the stock on the first hard pullback. The pullback occurred very
quickly on light volume and the rally was very fast on increasing volume. The
stock never really pulled back for the remainder of the day. I exited intraday
as a divergence in the RSI indicator began to develop. I never took a short in
the stock in the subsequent days and was looking for another entry to the long
side. It never came, as the stock gapped up on an upgrade the following Monday.
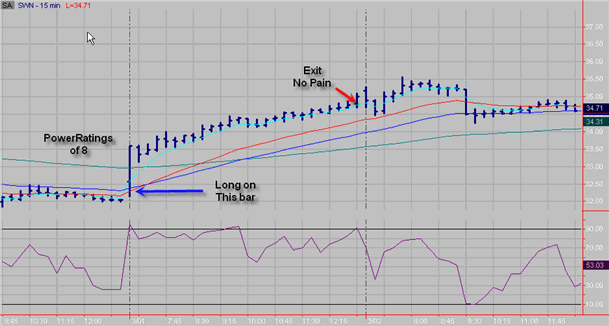
The final stock I want to discuss is SWN. On February 28, 2006 the stock
appeared on the nightly scan as an 8. I looked at the daily chart and noticed
several things. It had touched the 200 day moving average during the day. It had
tested a prior low and held. Finally, it had a divergence on a stochastic
indicator. It was definitely on the watch list.

The stocked had a small gap open on March 1,
2006. I was fortunate enough to get filled on the quick pullback and watched the
stock rally all day. I exited near the close and never had any pain in the trade
at all.
Not every trade goes as perfectly as the ones I have discussed today. But the
trades that I have taken from the PowerRatings scans have provided enough
“predisposition†edge to make sure that I check them every evening. I have many
different ways to find trading candidates for each day, but the overall success
of these scans has made them the number 1 choice for my watch list each morning.
John Emery
A quick note from Ashton
Dorkins: I hope you enjoyed John’s article. Please feel free to send to me
any questions or comments you may have about John’s work and trading. My email
address is: ashtond@tradingmarkets.com.
