Here are the sectors I’m buying and selling
Like the previous day, the major
indices traded in a narrow, sideways range
throughout the entire session, but this time finished modestly lower. The
Nasdaq Composite snapped its four-day winning streak by closing 0.3% lower, as
did the S&P 500 Index
(
SPX |
Quote |
Chart |
News |
PowerRating). The Dow Jones Industrial Average
(
DJX |
Quote |
Chart |
News |
PowerRating)
lost 0.4%. The small cap Russell 2000 Index shed 0.8% and the S&P 400 Midcap
Index
(
MDY |
Quote |
Chart |
News |
PowerRating) lost 0.7%. Each of the broad-based indices closed in the lower
half of their intraday ranges, but off their lowest levels of the session.
The positive of Tuesday’s session is that the losses
occurred on lighter volume across the board. Total market volume in the NYSE
came in 4% lighter, while volume in the Nasdaq was 9% below the previous day’s
level. The drop in volume prevented the broad market from registering a
bearish “distribution day.” The lighter volume also tells us that the losses
were more the result of a lack of aggressive buyers as opposed to an abundance
of sellers. Market internals were negative, but declining volume only exceeded
advancing volume by a small margin.
Looking at yesterday’s individual sector performance,
(
BBH |
Quote |
Chart |
News |
PowerRating)
(Biotech HOLDR) was one of the only ETFs that turned in a strong performance.
BBH advanced another 0.8% to close at a fresh five-year high and is now
showing us a marked to market profit of nearly 5 points since our November 3
long entry.
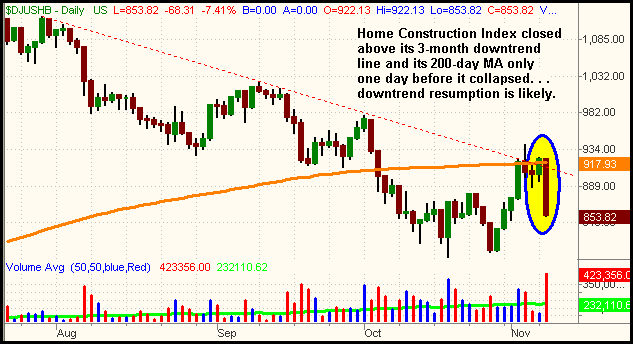
On the downside, the major industry standout was in the Home
Construction Index ($DJUSHB), which plummeted more than 7% yesterday after
homebuilder Toll Brothers
(
TOL |
Quote |
Chart |
News |
PowerRating) announced an earnings warning. We have
discussed this sector frequently over the past several months and, most
recently, after the index rallied into resistance of its primary downtrend
line and 200-day moving average last week. Interestingly, the index closed
above resistance of its primary downtrend line and 200-day MA only one day
before yesterday’s crash. Undoubtedly, yesterday’s selloff was accelerated by
the bulls who bought the November 7 breakout and immediately needed to dump
their shares. It now appears that the index will resume its primary downtrend
that has been in place since July:

In yesterday’s Wagner Daily, we briefly mentioned the
possibility of shorting MDY, which is the ETF that tracks the S&P 400 Midcap
Index. We provided regular subscribers with a full-serve trade setup to short
MDY as well. Upon studying the MDY chart further, we came to the conclusion
that this particular trade setup would provide a good educational example of a
type of entry that often provides a high reward/risk ratio.
If only looking at the price action of MDY over the past two
weeks, the chart actually looks bullish. The hourly chart below illustrates
the performance of MDY from October 27 to present:

Although not shown on the hourly chart above, MDY found
support at its 200-day MA on October 27, then began to trend steadily higher
and continued doing so until November 3. Then, for the next three successive
days, which includes yesterday’s action, MDY consolidated in a narrow,
sideways range near its highs. Because bullish consolidations such as these
often lead to new highs, this would not make for a good short setup if
this was the sole time interval that existed. However, traders must always
consider the bigger picture of a stock or ETF’s trend by looking at multiple
time frames of charts. Failure to do so often causes you to miss major support
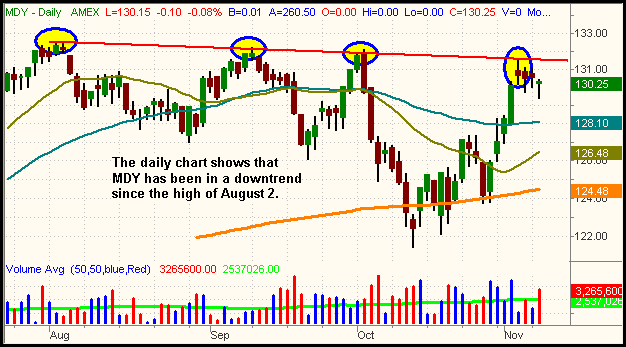
or resistance levels. In this case, a look at the daily chart clearly shows
that MDY ran into resistance of its daily downtrend line only a few days ago:

When comparing the hourly chart with the longer-term daily
chart of MDY, you see conflicting signals because the hourly chart looks
bullish, but the daily chart shows resistance of a 3-month downtrend line.
When conflicting signals are present on multiple time frames, the chart with
the longer time frame holds more weighting and prevails a majority of the
time. Therefore, odds favor MDY resuming its primary downtrend more than the
possibility of a breakout on its hourly chart. When ETFs and stocks have been
trending in a particular direction for several months, we never guess or try
to anticipate when that trend will be broken. Instead, we simply trade in the
same direction of the trend through buying pullbacks on uptrending ETFs and
selling short the rallies on downtrending ones.
By selling MDY short on a rally into its primary downtrend
line, we receive a very high reward/risk ratio on the trade. If the trend
resumes in the downward direction, we are looking at a potentially large
profit because we shorted on a bounce into resistance instead of shorting a
break of support. Conversely, we are able to keep our loss minimal if MDY
breaks out of its downtrend because we simply cover the position as soon as
MDY rallies above the downtrend line.
Shorting MDY at its current price enables you to keep a stop
loss of less than two points because you don’t want to be short MDY anymore
if it rallies more than a few cents above its November 3 high. The
positive, however, is that you are looking at a potential profit of eight or
more points if MDY resumes its downtrend and drops to test its prior low. If
risking 2 points for a potential gain of 8 points, an entry in this trade at
the current level gives you a reward/risk ratio of 4 to 1 (four points reward
for each point of risk). As a general rule of thumb, we look only for trade
entries that have a potential reward/risk ratio of at least 2 to 1
(usually more). Professional traders are not concerned with whether they are
right or wrong on a trade. Rather, they focus on consistently entering trade
setups that provide a positive reward/risk ratio in order to stay profitable
over the long term.
Open ETF positions:
Long BBH, short MDY (regular subscribers to
The Wagner Daily receive detailed stop and target prices on open
positions and detailed setup information on new ETF trade entry prices.
Intraday e-mail alerts are also sent as needed.) If you analyze
long-term trade statistics of
The Wagner Daily, you will see that we have an average accuracy
rate of about 50 – 60% on our winning picks, but you will also see that
our average winner is usually more than twice the size of our average loser.
This is the reason Morpheus Trading has been consistently profitable since
inception. You can do the same if you commit to only entering new trades that
have a firmly positive reward/risk ratio.
Deron Wagner is the head trader of Morpheus Capital Hedge Fund and founder
of Morpheus Trading Group (morpheustrading.com),
which he launched in 2001. Wagner appears on his best-selling video, Sector
Trading Strategies (Marketplace Books, June 2002), and is co-author of both
The Long-Term Day Trader (Career Press, April 2000) and The After-Hours Trader
(McGraw Hill, August 2000). Past television appearances include CNBC, ABC, and
Yahoo! FinanceVision. He is also a frequent guest speaker at various trading
and financial conferences around the world. For a free trial to the full
version of The Wagner Daily or to learn about Deron’s other services, visit
morpheustrading.com or send an e-mail
to
deron@morpheustrading.com .
