Here are the sectors I’m watching today
After beginning the day with an
opening gap down, the major indices chopped
around in negative territory before finishing the day modestly lower. The S&P
500
(
SPX |
Quote |
Chart |
News |
PowerRating) and Nasdaq Composite
(
COMP |
Quote |
Chart |
News |
PowerRating), down 0.6% at their intraday
lows, both closed 0.2% lower. The Dow Jones Industrials
(
DJX |
Quote |
Chart |
News |
PowerRating) and small-cap
Russell 2000 indices each lost 0.3%, while the S&P 400 Midcap Index fell 0.4%.
Most of the indices closed just above the middle of their intraday ranges,
pointing to indecision that followed the previous day’s gains.
The broad market divergence we spoke of in the March 2 issue
of
The Wagner Daily
again showed itself in yesterday’s volume patterns. Total volume in the NYSE was
10% higher than the previous day’s level, but volume in the Nasdaq declined by
7%. This means that the S&P registered another bearish "distribution day," its
second one this week, but the Nasdaq retraced on lighter volume. Over the last
three days, the S&P has had two "distribution days" (closed lower and on
higher volume) and one lighter volume up day. Compare that bearish action with
the Nasdaq, which has had one "distribution day," one "accumulation day" (closed
higher and on higher volume), and one lighter volume day of losses.
Although the chart patterns of the S&P and Nasdaq may look similar, a closer
look "under the hood" reveals that institutional money has been flowing out of
the S&P and Dow and into the Nasdaq.
Because the broad market has been in a trading range for the
past several weeks, we have been focusing most of our daily technical analysis
on specific industry sectors instead of the major indices. However, the broad
market’s indecision of the past several days has changed the technical patterns
of a few sectors we recently discussed. As such, we feel it would be beneficial
to take a brief, updated look at a few of the sectors we have discussed in
recent issues.
In no particular order, recently discussed sector ETFs with
bullish chart patterns were: IGW (Semiconductors), RTH (Retail), IYH
(Pharmaceuticals), IBB (Biotech), GLD (Gold Trust), and FXI (China). Of these,
we feel that IGW, IBB, FXI, and GLD each continue to act well and are showing
relative strength to the markets. IGW, which woke up on March 1, remains poised
to break out of a bullish eight-week consolidation. IBB and FXI are both holding
near their highs as well, but are riskier entries at current prices. Consider
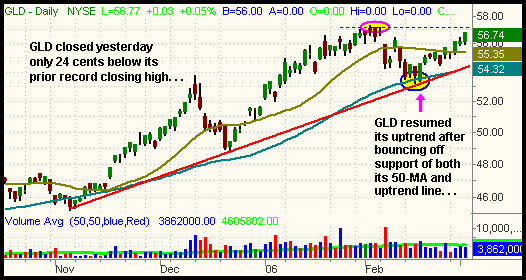
trailing stops higher if already long either of those two ETFs. GLD, which
perfectly bounced off support of both its 50-day MA and primary uptrend line in
mid-February, closed yesterday only 24 cents below its all-time high:

As the chart above illustrates, a close above 56.98 would
represent a new record high in GLD. We expect a test of this prior high over the
next several days. It should be noted, however, that the individual gold mining
stocks that comprise the $GOX index have been lagging behind and showing
relative weakness to GLD and the spot gold commodity itself. Since our original
analysis, only RTH and IYH appear to have failed their recent breakout attempts.
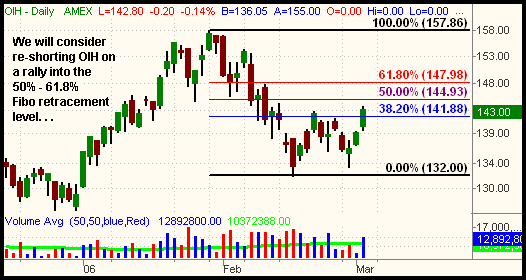
On the downside, the only sector ETF we have discussed at
length is OIH (Oil Service). Although we netted more than a 10 point gain by
shorting OIH in the first half of February, it has since rallied above its daily
downtrend line. It also closed yesterday above its 20 and 50-day moving
averages, as well as its prior high from February 21. Because of this, we expect
OIH to rally a bit higher in the short-term. However, a rally into its 50% or
61.8%
Fibonacci retracement should provide a low-risk re-entry point to sell short
OIH. The daily chart below illustrates those levels at which we will consider
re-shorting OIH. Note that we have removed the moving averages so that you can
more easily see the Fibonacci retracement lines:

Much of our recent discussion has focused on shorting the
broad-based ETFs such as SPY and MDY. However, the action over the past several
days has been erratic because the divergence between the S&P and Nasdaq is
growing stronger. Therefore, entering new long OR short positions in the
broad-based ETFs right now is probably not advisable. We remain short SPY, which
we entered on February 28, but have a tight stop just over the February 27 high.
Unfortunately, mixed signals caused by divergence within the major indices often
causes wild and unpredictable price action across the board. As such, we don’t
plan to enter any new broad-based ETF positions until the indices get back in
sync with each other in one direction or the other.
Open ETF positions:
Short SPY (regular subscribers to
The Wagner Daily
receive detailed stop and target prices on open positions and detailed setup
information on new ETF trade entry prices. Intraday e-mail alerts are also sent
as needed.)
Deron Wagner is the head trader of Morpheus Capital Hedge Fund and founder of
Morpheus Trading Group (morpheustrading.com),
which he launched in 2001. Wagner appears on his best-selling video, Sector
Trading Strategies (Marketplace Books, June 2002), and is co-author of both The
Long-Term Day Trader (Career Press, April 2000) and The After-Hours Trader
(McGraw Hill, August 2000). Past television appearances include CNBC, ABC, and
Yahoo! FinanceVision. He is also a frequent guest speaker at various trading and
financial conferences around the world. For a free trial to the full version of
The Wagner Daily or to learn about Deron’s other services, visit
morpheustrading.com or send an e-mail to
deron@morpheustrading.com .
