Here are today’s key levels for emini traders
Several times last week inside this
forum we noted the distinct pattern of sessions following end-quarter events to
be rangy and/or volatile in nature. How’d we do on that forecast? It wasn’t
clairvoyance by any means… mere observation while dragging charts backward for
a couple of years clearly identified this pattern.
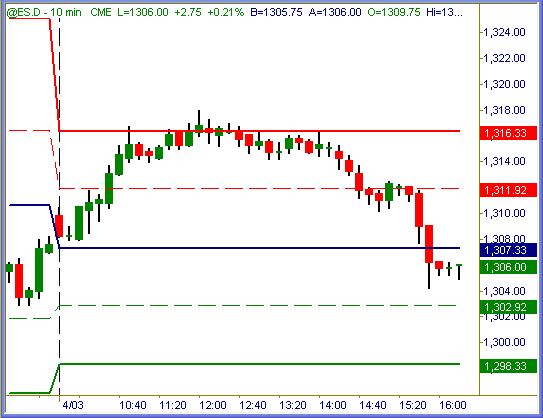
ES (+$50 per index point)
S&P 500 futures rose sharply from their daily
pivot point up to R2 values, where they coiled sideways for a few hours before
the afternoon trek down to new session lows. Once again there were three
distinct swings of greater (much greater) than +4pts each past the entry
signals. Very simple, very methodical day to trade the S&Ps in what is merely
normal market action.
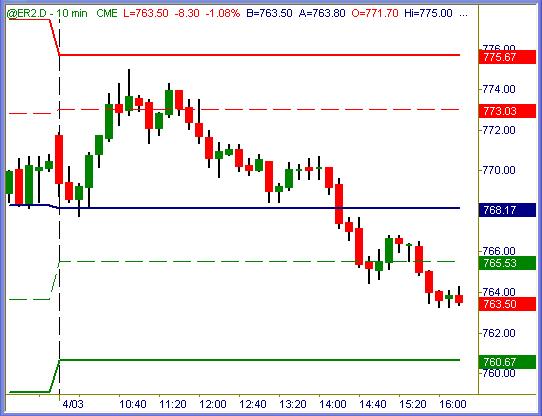
ER
(+$100 per index point)
Russell 2000 futures were a bit more erratic as
the often are, but still highly tradable inside normal range behavior. An
opening gap filled at the pivot, lifted nearly to R2 value and then worked its
way lower beneath the S1 value to finish the day. Lots of profitable swings in
this tape, lots of profit potential numerous times intraday.
ES (+$50 per index point)
The daily chart view of ES shows past five
consecutive sessions to be a volatile, muddled mess. All of those high
tail/wicks clearly demonstrate buyers cannot hold highs of the day, at all.
Notice how the wedging action of inside days prior have since widened into
sideways buzz? That will not last much longer… each side of buyers & sellers
is battling for the upper (or lower) hand. When one side prevails, we will see a
directional surge that carries further than most expect it can.

Up or down is unknown to any man on earth, and
is nothing more than a pure guess. When directional breakout prevails, traders
who react accordingly and play the trend in harmony with market action will be
delighted, for sure.
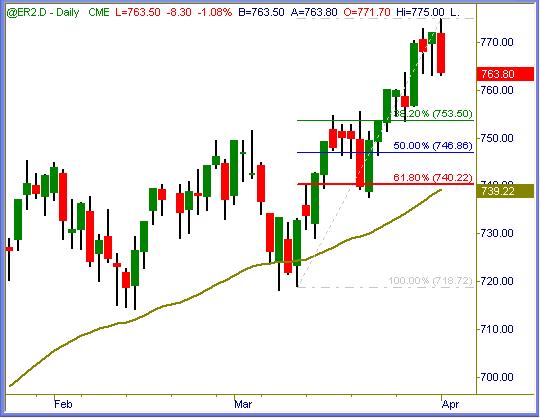
ER
(+$100 per index point)
Russell 2000 almost painted a two-day bearish
engulfing candle, but held Friday lows at the end. This is still a bearish
pattern and could result in continuation lower unless buyers step in and jack
the small caps upward like have so many times in the past. Daily chart remains
100% bullish, but most other indexes are foundering at best.
Summation
Last week was very low on the volatility = intraday range scale. This week began
with normal market action, and should continue or improve through the week. They
can only hang ’em sideways for awhile, not forever. Eventually a lasting
directional move will ensue. Until then we’re content to play the widened swings
either way with equal aplomb.
Trade To Win
Austin P
(Online video clip
tutorials…
open access)
Austin Passamonte is a full-time
professional trader who specializes in E-mini stock index futures, equity
options and commodity markets.
Mr. Passamonte’s trading approach uses proprietary chart patterns found on an
intraday basis. Austin trades privately in the Finger Lakes region of New York.