Here is where I see potential low-risk entries
Stocks immediately rallied higher out of the gates
Monday morning, but the buying momentum quickly dried up, causing the
major indices to drift back down to unchanged levels after the first thirty
minutes. From there, the broad market remained in a narrow, sideways range
throughout the remainder of the day before closing with mixed results. The S&P
500
(
SPX |
Quote |
Chart |
News |
PowerRating) and Dow Jones Industrial Average
(
DJX |
Quote |
Chart |
News |
PowerRating) closed lower by 0.2%
and 0.3% respectively, but the Nasdaq
(
COMP |
Quote |
Chart |
News |
PowerRating) continued to show relative
strength and managed a gain of 0.2%. Midcaps and Smallcaps outperformed the
Nasdaq, with the S&P 400 gaining 0.6% and the Russell 2000 moving 0.4% higher.
Unlike the prior two days in which the broad market closed strong, each of the
major indices closed near the middle of their intraday ranges. Of notable sector
performance, the Biotech Index
(
BTK |
Quote |
Chart |
News |
PowerRating) surged 2.4% higher and closed at a
fresh 4-year high.
(
BBH |
Quote |
Chart |
News |
PowerRating) (Biotech HOLDR), however, has been lagging behind
the $BTK index due to relative weakness in some of the more heavily weighted
biotech stocks.
Total volume in the NYSE increased by 2% Monday, while volume in the Nasdaq
was 11% higher than the previous day’s level. Because the S&P closed lower, but
the Nasdaq closed higher, analysis of yesterday’s volume levels gives us mixed
signals. The S&P 500 technically had a bearish “distribution day” that results
from losses on higher volume, but the Nasdaq conversely had a bullish
“accumulation day” from gains on higher volume. Market internals were positive
in both the NYSE and Nasdaq, but advancing volume only marginally
exceeded declining volume levels.
In Monday’s Wagner Daily, we brought your attention to resistance of
the intermediate-term downtrend lines on both the S&P 500 and Nasdaq Composite.
Both indices have rallied significantly during the past week, providing
investors with a positive feeling about the markets. However, a quick look at
the daily charts shows that both the S&P and Nasdaq have come into resistance of
their respective downtrend lines, meaning that entering new long positions is
risky unless the indices close firmly above those trendlines. The S&P initially
probed above its downtrend line yesterday morning, but sold off to close below
it. The Nasdaq, despite a small gain, also remains below its downtrend line. It
also closed right at resistance of its 50-day moving average. Until the market
proves otherwise, we must assume the downtrends that have formed on both the S&P
and Nasdaq will remain intact. Rather than being redundant and showing you the
same charts again, just review
yesterday’s
Wagner Daily to note the proximity of those downtrend lines.
While doing our nightly research, we noticed that many other indexes and ETFs
have come into or are fast approaching resistance of their daily downtrend lines
as well.
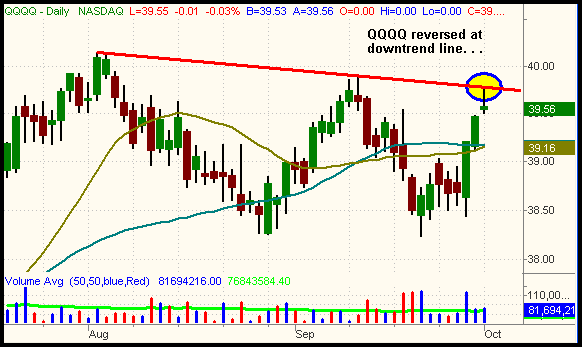
(
QQQQ |
Quote |
Chart |
News |
PowerRating) (Nasdaq 100 Index) reversed after running into resistance
of its two-month downtrend line yesterday, while
(
MDY |
Quote |
Chart |
News |
PowerRating) (S&P 400 Midcap
Index) closed right at its downtrend line.
(
IWM |
Quote |
Chart |
News |
PowerRating) (Russell 2000 Smallcap
Index) still remains below its downtrend line. Since both MDY and IWM were
leaders of the broad market during the last uptrend, the inability of these
indices to recover above their downtrend lines would be significantly bearish.
The closely watched QQQQ is at a “make it or break it” level that will result in
either a resumption of the downtrend or a breakout to new highs. The red
descending lines on the charts below illustrate the current downtrends in QQQQ,
MDY, and IWM:


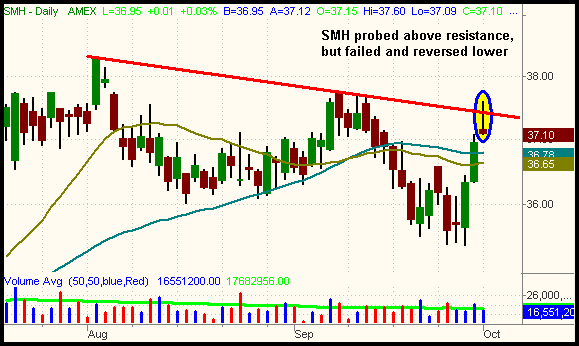
In addition to the broad market indices above,
(
SMH |
Quote |
Chart |
News |
PowerRating) (Semiconductor HOLDR)
also has run into resistance of its downtrend line. Notice how it backed off
yesterday, just as QQQQ did:

When only one major index is near a key support or resistance level, but the
other indices are performing inversely, the performance of the divergent index
is often irrelevant. But when many indexes and sectors confirm each other with
similar chart patterns, it increases the likelihood of those chart patterns
following through. As you have seen, many of the major market indices are at or
near key resistance levels. If the downtrends resume, this will present us with
low-risk entry points for new short positions on the bounce into resistance.
Therefore, we will be watching for signs of price failure and institutional
distribution over the next several days. If we see it, we expect to enter new
short positions. If, however, the indices begin to breakout above their
downtrend lines, all bets are off on the short side. For now, lay low and wait
for market confirmation before making any big bets on either side of the market.
Open ETF positions:
Long GLD and FXI (regular subscribers to
The Wagner Daily receive detailed stop and target prices on open
positions and detailed setup information on new ETF trade entry prices. Intraday
e-mail alerts are also sent as needed.)
Deron Wagner is the head trader of Morpheus Capital Hedge Fund and founder of
Morpheus Trading Group (morpheustrading.com),
which he launched in 2001. Wagner appears on his best-selling video, Sector
Trading Strategies (Marketplace Books, June 2002), and is co-author of both The
Long-Term Day Trader (Career Press, April 2000) and The After-Hours Trader
(McGraw Hill, August 2000). Past television appearances include CNBC, ABC, and
Yahoo! FinanceVision. He is also a frequent guest speaker at various trading and
financial conferences around the world. For a free trial to the full version of
The Wagner Daily or to learn about Deron’s other services, visit
morpheustrading.com or send an e-mail
to
deron@morpheustrading.com .
