Here’s A Heads Up For Next Week
What Thursday’s Action Tells
You
The range narrowed to 4.8 points, but the SPX
(
$SPX.X |
Quote |
Chart |
News |
PowerRating) was able to hold price at 1183.55, +0.1%. The Dow
(
$INDU |
Quote |
Chart |
News |
PowerRating)
was +0.2% to 10,573, as was the Nasdaq
(
$COMPQ |
Quote |
Chart |
News |
PowerRating) at 2104. The
(
QQQ |
Quote |
Chart |
News |
PowerRating)
was the leader again at +0.5%, primarily due to the
(
SMH |
Quote |
Chart |
News |
PowerRating) which tacked
on
+1.5%, closing at 34.80. It has been rising price on declining volume since
the
32 level, but “up is up,” said Yogi. Minor support today becomes
the
233-/200-day EMAs at 34.06 and 33.85. Below that is the position stop to
exit
this current long trade off the 1,2,3 higher bottom (daily
chart).
Daytraders had the hat trick yesterday, as
the
(
OIH |
Quote |
Chart |
News |
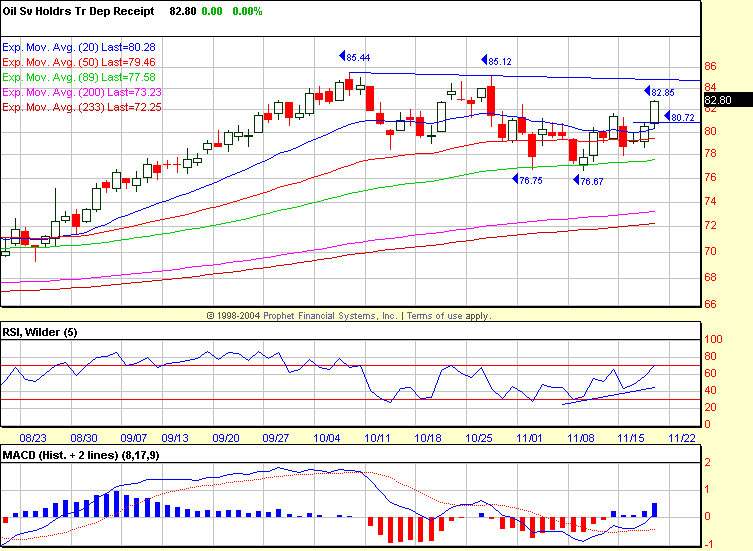
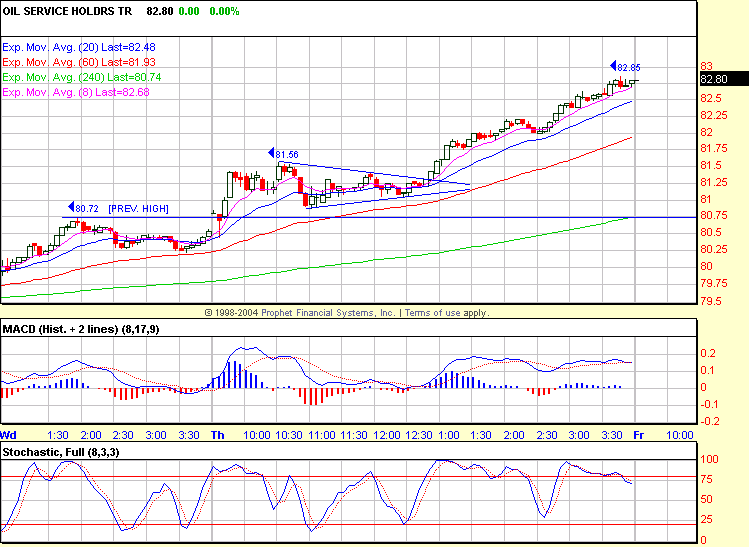
PowerRating) had a +2.8% day following +1.7% on Wednesday and +0.3% on Tuesday.
There were some excellent energy trade-through entries that ran +4.0% and
+5.4%
from entry, while the OIH was +2.6% from entry. It is nice to catch a
moonshot
when the major indices go narrow range on us, which is the obvious benefit
of
trading more than just the E-minis, provided your risk capital allows you
to.
NYSE volume was 1.46 billion yesterday, the
volume ratio neutral at 52 and breadth flat at +4. The
(
SPY |
Quote |
Chart |
News |
PowerRating) is in a
narrow-range five-day pattern, closing yesterday at 118.74. The high close
of
the last five days is 118.79 with yesterday’s high at 118.80, so that is the
initial upside focus today. The intraday high of the five days is 119.14,
but if
you play any continuation breakout of the range, use 118.80 as your entry
focus.
The SPY volume was only 31.9 million yesterday, the lowest since the October
holiday volume of 20.2 million. Yesterday’s inside day low was 118.23.
The SPY rally in May from 108.06 to 114.94
was
+6.4% in 18 days. The August advance from 106.59 to 113.74 was +6.7% in 21
days.
The current advance from the key price and time zone and 109.35 low is now
18
days old, having advanced +9.0% low-to-high so far with only a four-bar
consolidation and now the current five-bar narrow-range pattern. There has
been
no retracement as the Generals have pushed price since the election, in
addition
to the acceleration trading through the 1144.94 high monthly close of 2004
and
then again through 1161, which is the .50 retracement to 1553 from 769, the
October 2002 low.
The SPY, QQQ and IWM have made new rally
highs,
while the Dow and Nasdaq trail. The previous Nasdaq high is 2154 and 10,754
for
the Dow. The Dow Transports surpassed its January 2004 3090 high in June and
closed yesterday at 3612. This is right at the 3620 2.618 extension of the
last
significant leg down from 3212 – 2960, so price action is important in this
zone.
The primary price and volume trend yesterday
from
the S&P 500 screen on my commentary page was the energy stocks, as the
“players” had a head start on some OPEC noise again about cutting production. The OIH
is
stretched low-to-high in two days from 78.65 to 82.85, closing yesterday at
82.80, so don’t chase price above yesterday’s high on any first entry. If
they
go red, then the 81.75 level is the initial retracement of interest, then
80.75.
Next week is the holiday, so trading will be
subject to less liquidity. Last year, the SPY had declined in five days from
106.95 to 103.62 and the 50-day EMA on 11/21 (Friday). In the next five
trading
days, it traded +3.9% to 107.68 with volume never over 39 million shares, so
the
market is easily pushed around during this timeframe. In 2003, the SPY
advanced
+4.8% from 91.62 on 11/26 (Tuesday) to 96.05 in four trading days to Monday,
12/02. Net net, I guess that means no heroes, people, on the short side next
week.
Have a good trading day,
Kevin Haggerty
Trade
with Kevin for a year.
Click here.


