Here’s a new way of using the TradingMarkets stock scanner
Today’s article will show you how to use our
TradingMarkets Stock Scanner along with
PowerRatings to identify trending
stocks.
As traders, we are always looking for ways to
find trending stocks. Sometimes this can take hours each night scanning
through hundreds or maybe even thousands of charts. In today’s
PowerRatings article, I show you a free tool that can be used in conjunction
with PowerRatings to help speed up the
process:
The TradingMarkets Stock Scanner.
In this example we define an uptrend as being
above the 50-day
moving average. Moving averages help us
to see where the current price is compared to past periods. To calculate a
simple moving average we take the closing prices for a set number of periods,
add them together, and then divide by the number of periods. For example:
a 10-day simple moving average is calculated by adding the closing prices for
the last 10 days and dividing the total by 10.Â
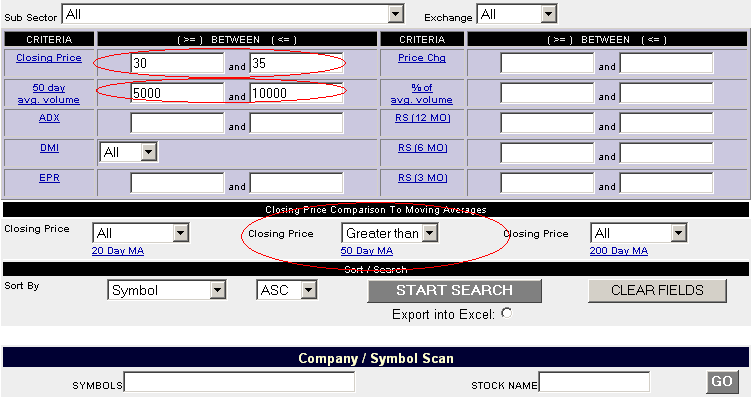
To search for stocks with prices greater than the
50-day simple moving average, choose “GREATER THAN” in the following
circled parameter boxes:

I have also included other parameters to help
shorten our list of resulting stocks. I prefer to trade stocks that are between
$30.00 and $35.00 in price. Also, I look for stocks that have a good
degree of liquidity, so that entries and exits can be made more easily.Â
Therefore, I inserted 5000 and 10000 into the 50-day average volume box (The
volumes are in 100’s, so inputting 5000/10000 means you are looking for volume above
500,000 and below 1,000,000).Â
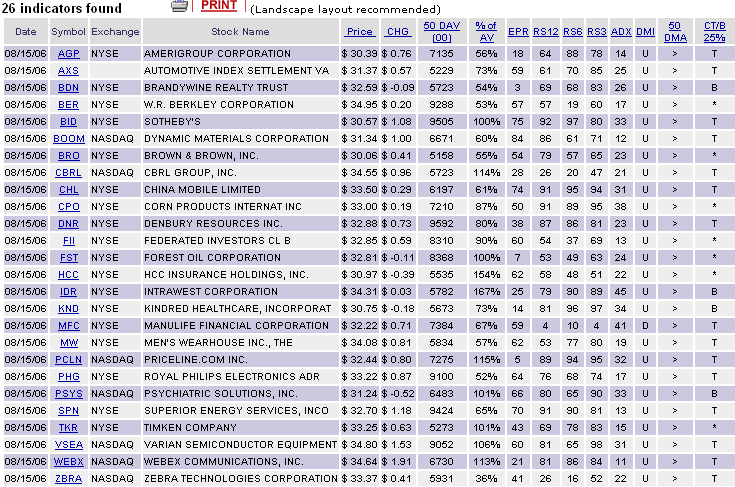
Here is a partial list of the scan
results:

We can then check each resulting stock’s
PowerRatings. The stocks rated 7 or higher whould be put on your watch
list.
From 1995-2005, stocks rated 7 have
outperformed the S&P 500 by a better than 4-1 margin over a five-day period.
Stocks rated 8 have outperformed the S&P 500 by a better than 8-1 margin; stocks
rated 9 have outperformed the S&P 500 by a 13-1 margin, and those stocks that
have achieved a 10
PowerRating have
outperformed the S&P 500 by a 16.9-1 margin.
You should not consider any of these stocks as
“buy candidates.” Rather they are a starting point in your search for strong
stocks that fit your own strategy’s trading criteria.
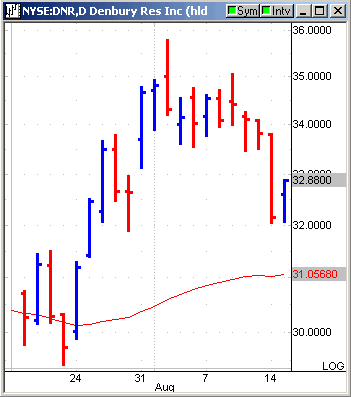
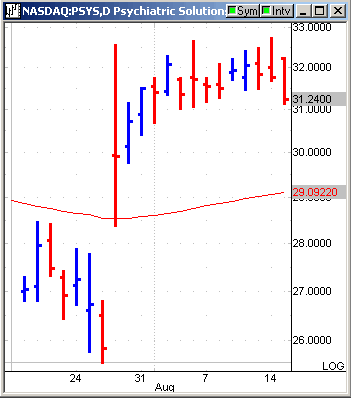
Here are a few charts from stocks rated 7 or
higher:
Denbury Resources
(
DNR |
Quote |
Chart |
News |
PowerRating)

Psychiatric Solutions
(
PSYS |
Quote |
Chart |
News |
PowerRating)

Â
You can
attend a free
class on how to use
PowerRatings,
presented by Steve Primo, our Director of Education.
Click here to
try
PowerRatings for yourself, risk free.
Darren Wong
Associate Editor
Want a free month of PowerRatings?
Send us your PowerRatings
strategy and receive one free month of this exciting trading tool. If you are
already a monthly or annual PowerRatings
subscriber, you will receive an additional three months if we publish your
strategy.
Reminder: We are in no way recommending the purchase or short sale of these
stocks. This article is intended for education purposes only. Trading should be based on your own understanding of market conditions,
price patterns and risk; our information is designed to contribute to your
understanding. Controlling risk through the use of protective stops is critical.
