Here’s a real-time trend definition setup
Dave Floyd is a professional FX and stock trader based in Bend, OR and the
President of Aspen Trading Group. Dave’s approach to FX combines technical
and fundamental analysis that results in trades that fall into the swing
trading time frame of several hours to several days. For a free trial to
Dave Floyd’s Daily Forex Alerts
or call 888.484.8220 ext. 1.
CAD/CHF, while one of the lesser-followed crosses, is nonetheless
one that is coming together nicely on the 3 time frames I follow, 60 &
240-minute and daily charts.
The chart below is the 240-min chart and outlines some of the logic behind
wanting to get short.
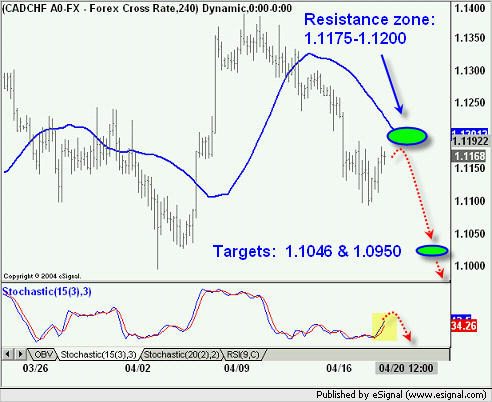
With reference to Monday’s lesson regarding ‘Trend
Definition’ pull up charts on your platform on all 3 time frames noted above
— you will see that all are sloping down to the right, a downtrend, hence,
placing a short is staying in harmony with the market and increases the odds of
success on the trade.
Does it mean that I will short once prices trade at the Resistance Zone? No.
This area is simply a reference point, an area where I believe prices may stall,
when and if it gets to that area, I will re-evaluate once again.
As always, feel free to send me your comments and questions.
Aspen Trading Group