Here’s an energy play for aggressive traders…
Don’t Say the Market Didn’t
Warn You
Well, the first week in October was horrible if
you were long the market. The S&P 500 was down 2.67%, the Dow Jones was down
2.61%, and the NASDAQ was down 2.85%. Energy took the worst of the beating. I am
not surprised. Not that I feel any better about getting the stuffing kicked out
of me, especially due to my involvement in the energy sectors, but I am not
surprised.
The New York Stock Exchange Bullish Percent
Indicator, which is the main overall indicator for the Point and Figure Method,
reversed to Os on September 23rd. The indicator measures the number of stocks on
the New York Stock Exchange giving new buy signals. If 6% of stocks on the
Exchange move from being on buy signals to being on sell signals, then the
indicator will reverse. Remember that a buy signal is a column of Xs rising
above a previous column of Xs and that a sell signal is a column of Os falling
below a previous column of Os. In other words, stocks are able to move higher
than they have been in the past, or stocks are moving lower than they have been
in the past.
So, if the indicator reversed to negative on
September 23rd, than those following the indicator had plenty of time to get out
of the way of the decline in the broad market. The indicator is not perfect, as
there is no crystal ball; however, it is correct enough of the time in order to
take it seriously. What are some things that can be done when this indicator
reverses? Well, because the indicator is fallible, and would only pertain
specifically to your portfolio if you owned all of the stocks on the NYSE, I do
not recommend just randomly raising cash. If you have a stock that breaks down
(gives a sell signal), then I would recommend selling it, especially if it is in
a poor sector. However, each situation is different, and my personal decision to
sell involves many factors.
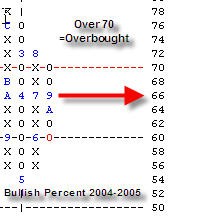
Unfortunately, the writing on the wall in regards to energy was not as clear as
it was for the overall market. I did allude to the fact that the sector was
overbought in my article last week; however, I did not expect such a steep
decline. The sector Bullish Percent Chart for Oil was still positive (in Xs) as
of last week, albeit above the 70% demarcation level of technically overbought.
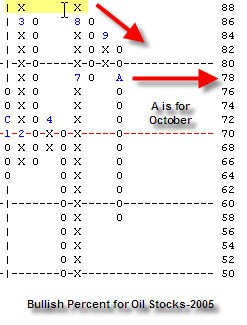
It did reverse this past week and in a dramatic fashion. The Bullish Percent
Chart for Oil moved from 82% of the stocks in the oil sector being on buy
signals to only 58% of the stocks in the oil sector being on buy signals.
Investors didn’t have much time to get out of the way. Notice how this indicator
is now making a series of lower tops as it failed to move above the 88% level
and then made a top at the 84% level.
For those that follow the underlying commodity in
order to get a clearer picture on the stocks dealing in the commodity, the news
wasn’t much better. The continuous crude oil chart broke below its’ support at
$63.00, completing a triple bottom break at $62.50. The commodity also closed
below its 50 day Exponential Moving Average. The decline was contained all in
the last four days (Friday saw a slight bounce) and, again, there wasn’t much
time to get out of the way. This chart, too, is making a series of lower tops.
What to do now? Because the broad market, as
evidence by the NYSE Bullish Percent Indicator, is still in Os, and declining,
be vigilant about setting stops and executing on them when they are violated. If
the indicator breaks below the 54% level, we could expect to see a further
decline in the broader market.
What about energy holdings? As we all should
know, if you weren’t over-weighted energy last year, and this year (up until
now), then you haven’t made much money being long the market. My suggestion is,
that if you didn’t get spooked last week, evaluate each individual energy
holding that you have and make a judgment about when to sell it. Keep in mind
that the fall off was so swift that some of the stocks (and the sector as a
whole) have moved from being overbought down into a position where it might be
attractive to go back into again with a long position.
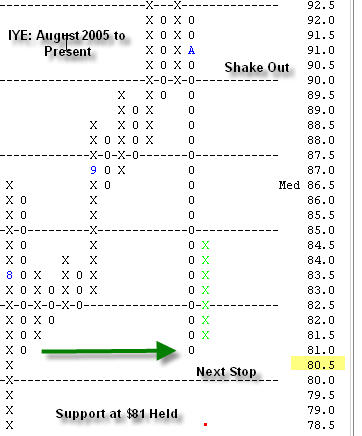
Also, the Reuters CRB Index that I wrote about
last week has not fallen below its support, and has also pulled back into a
position that looks attractive for new buys. For those very aggressive traders,
you could even purchase the iShares Dow Jones U.S. Energy Sector
(
IYE |
Quote |
Chart |
News |
PowerRating),
exchange traded funds, as it’s’ support held at $81.00. If it declines to $80.5,
then go ahead and sell out the position. From where it is trading now, the risk
would be a decline of 4.59%. Keep in mind that the momentum is negative and that
is why I am recommending the trade for aggressive traders only.
Sara Conway
Sara Conway is a
registered representative at a well-known national firm. Her duties
involve managing money for affluent individuals on a discretionary basis.
Currently, she manages about $150 million using various tools of technical
analysis. Mrs. Conway is pursuing her Chartered Market Technician (CMT)
designation and is in the final leg of that pursuit. She uses the Point and
Figure Method as the basis for most of her investment and trading decisions, and
invests based on mostly intermediate and long-term trends. Mrs. Conway
graduated magna cum laude from East Carolina University with a BSBA in finance.