Here’s An Interesting Statistic
The major indexes recorded their 3rd losing week of the
2005, and finished at the week’s lows, as an overall positive news
flow was unable to impress market players. This was the 1st year since 1982
that the major indexes all finished lower in the first 3 weeks of the year.Â
Instead of focusing on respectable earnings from General Electric, Yahoo, and
Citigroup, market players keyed in on disappointing reports. At the top of the
disappointment list was eBay, as the Internet bellwether missed estimates and
guided numbers down for the future. The entire Technology sector turned in a
very weak performance, as evidence began to mount of weakness in both the Chip
and Telecom Equipment spaces. Â
The March
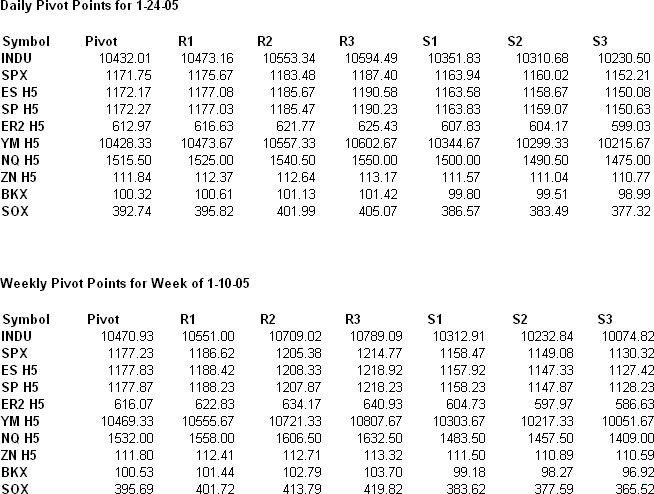
SP 500 futures closed out the week with a loss of —15.25 points, while the Dow
futures tumbled -154 points, and essentially erased all of 2004’s gains. Both
contracts have managed to erase about 8 weeks of upside work just in the past 3
weeks. On a weekly basis, the ES is still holding its bearish Butterfly pattern
and is testing its 38% Fib retracement of its Oct-Dec up move. A clean break of
that leaves its 100-day MA at 1158 as next support. The YM also closed at its
38% Fib retracement of its Oct-Dec up move, and looks ready to test its 100-day
MA at 10360. For you daily 3-Line Break followers, the YM and ES remain short
with Break Prices of 10558 and 1183.25 respectively. The ER2 is also holding
its weekly Butterfly pattern and is testing its 50% Fib retracement of its
Oct-Dec up move. Also of concern is the volume pattern
during the week. The biggest red volume bars were posted during the 4 days while
prices were falling. The smallest green volume bar took place on Thursday, when
the market managed a modest bounce.
               
The U.S. Dollar posted a daily
market structure high and pulled back to its 10-day MA support, while the 10-yr
Note (ZN) continues to form both weekly and daily Symmetrical Triangles. The
Banking Index (BKX) is testing the lower end of its weekly up channel after
breaking its 100-day MA. The Semiconductor Index (SOX) continues to slide off of
its weekly Bear Flag and closed at its weekly lows after breaking its daily
flag.
Despite an
overall positive news flow on both the earnings and economics fronts, equities
have continued to lose ground. We have heard every excuse in the book, as
market pundits are citing issues such as the twin deficits, higher interest
rates, energy prices, and even terror concerns for the weakness. The problem
is, however, that these issues have been in place for a very long time, yet
stocks were able to move higher in much of 2004. Consequently, there is more to
the story of why stocks are acting so badly.
If I had to
pinpoint what the largest issue plaguing stocks has been, I would suggest equity
fund flows. In the first 3 weeks of 2005, roughly $6 billion has been taken out
of U.S. equity funds. This compares to a net inflow of $22 billion in the first
3 weeks of 2004. Also, the average inflow into U.S. equity funds in the month
of January over the last 10 years has been about $18 billion. January has
historically been a strong month for stocks mainly due to new money coming into
funds. And now that we have the opposite taking place, it’s been very difficult
for the key averages to sustain a rally for more than 1 day. Fund managers are
likely being forced to sell at any price in order to meet withdrawal
requirements. So far, there hasn’t been a sense of panic. However, if the
negative fund flow data continues to persist, it’s quite possible that we could
see this downtrend end in a capitulation-type low.
              Â
 Â
Â
Please feel free to email me with any questions
you might have, and have a great trading week!
Â
Â
Â
Â
