Here’s How I Frame My Action Levels
It was
a narrow-range day for the major indices,
with the SPX
(
$SPX.X |
Quote |
Chart |
News |
PowerRating) and Dow
(
$INDU |
Quote |
Chart |
News |
PowerRating) closing above the high of the low day, while the Nasdaq
(
$COMPQ |
Quote |
Chart |
News |
PowerRating) and NDX
(
$NDX.X |
Quote |
Chart |
News |
PowerRating) did not close above the low day’s high.
The Nasdaq closed at 1323.79, right at the head-and-shoulder neckline of 1327.
Trading above the 1331.04 high of the low day is where any upside move can get
traction, and then your downside pivot would become the 1327 neckline. Do I know
which way it gets resolved? No. Do I care? No. Why would I care because my
trading plan prepares me for either direction with entries and stops and is very
effective around key inflection points where the move can accelerate in either
direction. That’s where the best risk/reward is.
Yesterday’s NYSE volume
was one of the lightest we’ve seen this year, as the SPX gained but 0.5%, the
Dow +0.7%, and Nasdaq +0.2%. The volume ratio was neutral at 55, as was breadth
at +201.
The major indices are all
in negative territory as measured by the “820” trend criteria. For example, the
SPX closed at 860.32 vs. the .50 retracement of 861.45 and the head-and-shoulder
neckline at 870. The 8-day EMA is 863.58 and is below the 20-day EMA, which is
880.04. Needless to say, they are below the 50 EMA which is below the 200 EMA.
The same is true for the weekly “820” criteria, except that the EMAs are higher.
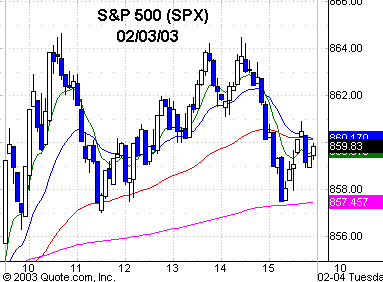
On an intraday 60-minute basis, the “820” is positive, with the SPX closing at
860.22, which is above the 8 EMA of 859.44 and the 20 EMA at 857.55. The
15-minute “820” is neutral, with the close 8 EMA and 20 EMA all about the same.
Next I looked at
yesterday’s high/low for the SPX, which is 864.64 and 855.70. The closing range
is 860.92 to 857.48, and this is where I focus for the first potential trade of
the day provided there are no gaps up or down. Now you have exactly what I did
this morning to frame my action levels. I also have the volatility band levels,
in addition to my monthly, weekly and daily pivot points that are in play. I
frame the SPX and trade the futures and/or the SPYs. I do the same thing for the
Dow, NDX, SMH or any other HOLDR or stock I think is at an action point.
We have just had a reflex
off the .618 levels for the SPX and Dow and a close above the high of the low
day, so we are ready for any continuation to the upside, but certainly cognizant
of the neckline resistance just above the closing prices. And you know there
will be a media blitz regarding Powell at the United Nations on Wednesday. That
all tells me to play the game on the intraday charts.
Have a good trading day.

Five-minute chart of
Monday’s SPX with 8-, 20-,
60- and 260-period
EMAs

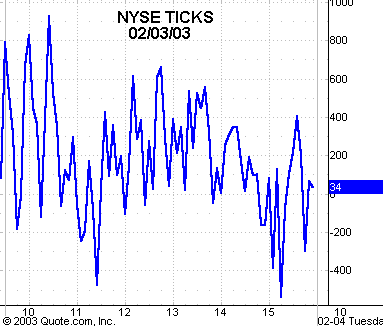
Five-minute chart of
Monday’s NYSE TICKS
