Here’s How I’m Trading the XLU
After beginning the day with an opening gap down, the broad market trended lower throughout the morning and never looked back. The Nasdaq Composite and Russell 2000 indices sustained the largest losses, as both indices fell 1.3%. The S&P 500, Dow Jones Industrials, and even the S&P 400 each lost 0.9%. Each of the major indices finished at their intraday lows and well below the prior morning’s lows that were triggered by Google’s weakness. This time, not even the relatively strong small and mid-cap stocks escaped the broad-based selling.
The one positive of yesterday’s session is that total volume in the NYSE was 4% lighter than the previous day’s level. Although the drop in turnover prevented the S&P from registering a bearish “distribution day,” volume in the Nasdaq was about 1% higher. One could argue that a mere one percent rise in the Nasdaq’s turnover was insignificant, but note that volume was higher during the morning selloff and gradually tapered off throughout the afternoon’s sideways action. As of 11:45 am EST, when the Nasdaq was at its lowest level of the day, volume was coming in 8% higher than at the same time on the previous day. More importantly, market internals were firmly negative. In the NYSE, declining volume exceeded advancing volume by a ratio of more than 3 to 1. The Nasdaq’s ratio was negative by just over 2 to 1.
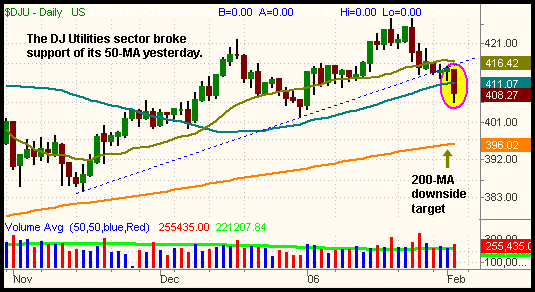
In the January 31, 2006 issue of The Wagner Daily, we pointed out the weakness and potential trend reversal that was setting up in the DJ Utilities Sector ($DJU). Specifically, we illustrated how the index was poised to break support of its daily uptrend line after forming a “lower high” on its long-term weekly chart. In order to confirm the weakness, we were looking for a break of the 10-week moving average, which is exactly what happened yesterday. The $DJU also fell below its similar 50-day moving average, resulting in a clear break of the daily uptrend line. Take a look:

Yesterday’s weakness in the Utilities sector caused our short setup in
(
XLU |
Quote |
Chart |
News |
PowerRating) (S&P Select Utilities SPDR) to trigger as well. If you shorted any of the Utilities ETFs or individual stocks, keep an eye on the performance of the $DJU over the next week. Our first target is for the $DJU index to fall down to its 200-day moving average, which is presently at the 396 level. If that occurs, it would represent an ideal time to take profits on any short positions you may have in that sector. Conversely, a rally above the 20-day moving average would force us to be very cautious on the short side, as it would represent a failed breakdown below the 50-MA.
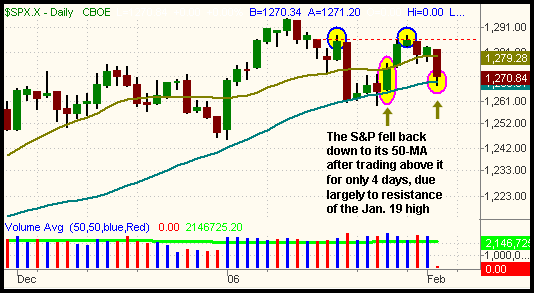
In yesterday’s Wagner Daily, we discussed how both the S&P 500 and Nasdaq Composite were having difficulty with resistance of their January 19 highs. After failing to break out above the prior highs in four consecutive sessions, the weight of that overhead supply caused both indices to fall yesterday. The S&P 500 is now in a precarious position, as it closed right at support of its 50-day moving average, but has formed a “lower high” on its weekly chart. While the 50-day MA normally presents a low-risk buying point, it is bearish that the S&P has fallen back down to its 50-MA after trading above it for only four days. Looking at the daily chart below, notice how quickly the S&P fell back down to its 50-day MA after bouncing off it on January 26:

Because of the “lower high” on the weekly chart and the rapid descent back down to the 50-MA, we feel the S&P is likely to break that support level within the next several days. As such, a break below yesterday’s low (and the 50-day MA) would represent an ideal short-entry point in SPY (S&P 500 Index SPDR). Regular subscribers should note our trigger, stop, and target price for the SPY short setup below.
QQQQ, the ETF that tracks the Nasdaq 100 Index, already closed below its 50-day MA and also presents a positive risk/reward ratio for shorting. The Dow has been showing a bit of relative strength over the past week and its chart pattern is less clear, so we recommend avoiding shorts in DIA for the time being. As for IWM (Russell 2000) and MDY (S&P 400), their major relative strength makes them higher risk short candidates, but their potential profits are also quite substantial if a broad-based wave of selling hits the markets. Only advanced traders should consider shorting IWM or MDY right now. If the markets were to suddenly reverse to the upside, the Russell and S&P 400 indices would probably once again lead the way.
Open ETF positions:
Short
(
XLU |
Quote |
Chart |
News |
PowerRating) (regular subscribers to The Wagner Daily receive detailed stop and target prices on open positions and detailed setup information on new ETF trade entry prices. Intraday e-mail alerts are also sent as needed.)
Deron Wagner is the head trader of Morpheus Capital Hedge Fund and founder of Morpheus Trading Group (morpheustrading.com), which he launched in 2001. Wagner appears on his best-selling video, Sector Trading Strategies (Marketplace Books, June 2002), and is co-author of both The Long-Term Day Trader (Career Press, April 2000) and The After-Hours Trader (McGraw Hill, August 2000). Past television appearances include CNBC, ABC, and Yahoo! FinanceVision. He is also a frequent guest speaker at various trading and financial conferences around the world. For a free trial to the full version of The Wagner Daily or to learn about Deron’s other services, visit morpheustrading.com or send an e-mail to deron@morpheustrading.com .
