Here’s how you can use the Relative Strength Index
Last week I had an excellent example of bearish
divergence in an oscillator forecast an impending decline in an individual
equity. Bearish divergence is often used with oscillator analysis and often
gives the best results. For those of you who are feeling a bit lost, let me give
a couple of definitions before proceeding.
First, an oscillator is any indicator that is generally used to determine
whether or not the entity you are analyzing is overbought or oversold. Common
examples include the Relative Strength Index (RSI) and Stochastic Oscillator.
They are called “oscillators†because they are able to move freely from 0 to 100
(and above and below if they aren’t normalized).
Second, bearish divergence is when the oscillator makes a lower high but the
price of the entity makes a higher high. In my example from last week, both
Stochastics and the Relative Strength Index made a lower high while the price continued to rise in
the equity. For the purpose of this column, I will focus your attention on the
RSI.
The Relative Strength Index is a measure of a stock’s recent gains over a fixed period of time (in this
case 14 days) versus its’ recent losses over the same period of time. A
rising RSI means that the stock has had more days that gained over the last 14
days then days that lost.
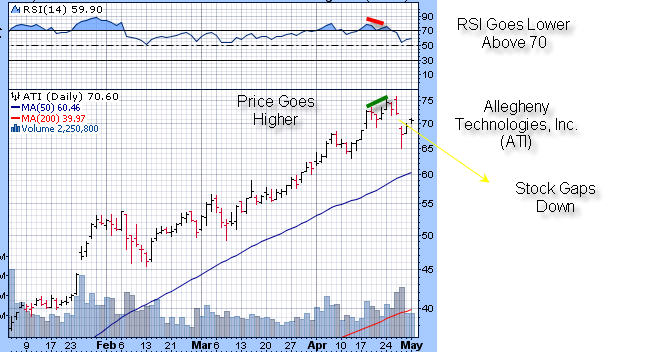
Focusing our attention on the chart above, one can see that on April 18th, the
price of Allegheny Technologies, INC.
(
ATI |
Quote |
Chart |
News |
PowerRating) closed at $72.72 and the RSI was
at 78.48. Please also note that divergences of this type are more meaningful
when occurring at extremes. Traditionally, the RSI is considered to be in
extreme territory when it is over 70 or under 30.
On April 24th, the price of ATI closed at $74.52 and the RSI was at 76.04.
Therefore, the price rose but RSI dropped and created a “bearish divergenceâ€.
Had the price dropped and the RSI risen, then a “bullish divergence†would have
been created. This bearish divergence, perhaps because other traders noticed it,
or perhaps because of some extraneous force, correctly forecast a drop in this
particular stock. This is not a tool I often use, but it can obviously be useful
in certain circumstances.
Sara Conway is a
registered representative at a well-known national firm. Her duties
involve managing money for affluent individuals on a discretionary basis.
Currently, she manages about $150 million using various tools of technical
analysis. Mrs. Conway is pursuing her Chartered Market Technician (CMT)
designation and is in the final leg of that pursuit. She uses the Point and
Figure Method as the basis for most of her investment and trading decisions, and
invests based on mostly intermediate and long-term trends. Mrs. Conway
graduated magna cum laude from East Carolina University with a BSBA in finance.