Here’s my advice for aggressive traders
Last week we noted a
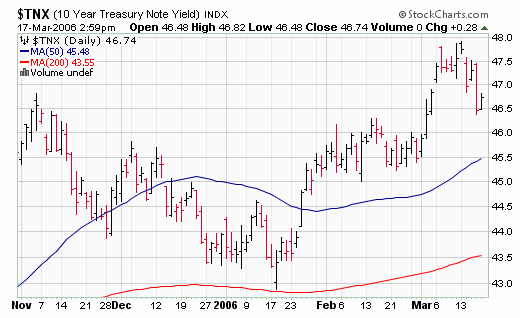
critical test of the 4.9%-5% yield level on the ten year bond and
that movements toward this level were hitting global markets. So far the
equilibrium that kept equities moving up is holding, as the 4.8% level seems to
have stemmed the advance in US 10 year rates and reports are leading investors
to project fewer rate cuts than was feared last week. This of course has hit the
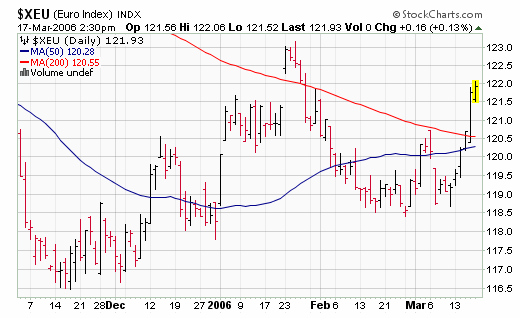
dollar, which looks setup to test the 1.235 level against the Euro. A breakout
by the dollar below 87.5 and EUR above 1.235 should lead to a renewed bear
market in the dollar, although a substantial drop is not indicated by rate
shifts at this time.
Investors should continue to watch the critical 4.9-5% rate on the 10 year bond
and get very defensive if it gives way. QQQQ’s also held their trading range and
did not break down, though the big cap internets are showing marked weakness. We
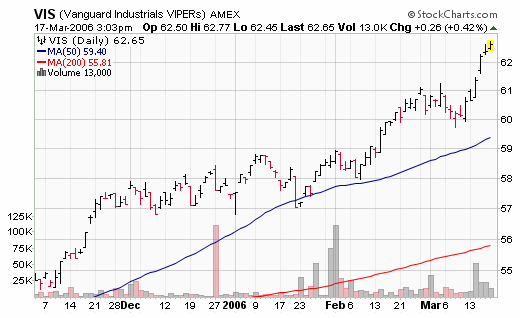
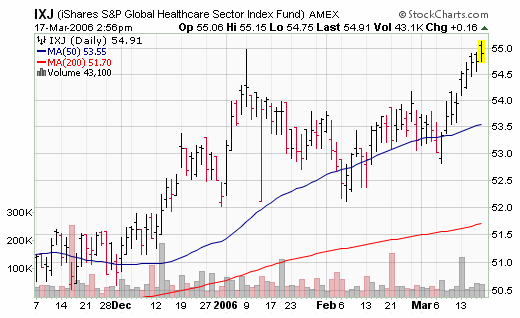
continue to like industrials and healthcare in particular here both relative and
outright, in addition to our frequently mentioned favorites. Indonesia has also
broken out and exhibits good value and likely positive macro’s so we like this
area as well.
On the weak side we still like big cap internets
and General Merchandise, as well as some interest-rate sensitive, like housing,
and big-cap growth. Aggressive traders could position with strong groups over
weak ones, but with more cautious allocation than normal.
However anything other than less than normal
positioning by anything other than aggressive traders should probably be
dictated on market action with plurality developing from here. Bond breakdowns
(bond yield breakouts) should send up a huge caution sign and aim aggressive
traders toward the bear side for trading opportunities. Watch
(
QQQQ |
Quote |
Chart |
News |
PowerRating) and
dollar for signals as well. Watching and waiting is what hunters must become
skilled at, and sometimes market hunters as well. The market equilibrium is
holding well, and may continue, but once it gives way risks rise substantially.
Our model portfolio followed in
TradingMarkets.com with specific entry/exit/ops levels from 1999 through May of
2003 was up 41% in 1999, 82% in 2000, 16.5% in 2001, 7.58% in 2002, and we
stopped specific recommendations up around 5% in May 2003 (strict following of
our US only methodologies should have had portfolios up 17% for the year 2003) —
all on worst drawdown of under 7%. This did not include our foreign stock
recommendations that had spectacular performance in 2003.
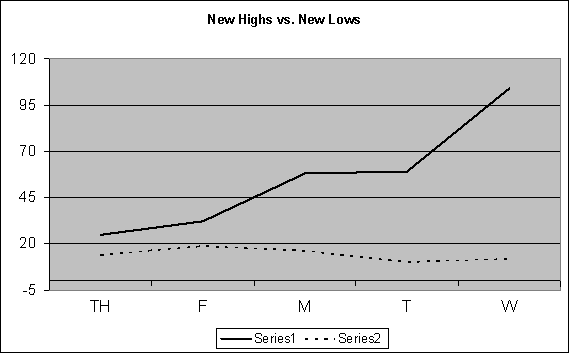
Meanwhile in our US selection methods, our Top
RS/EPS New Highs list published on TradingMarkets.com, had readings of 25, 32,
58, 59 and 104 with 13 breakouts of 4+ week ranges, no new trades and no close
calls. This week, our bottom RS/EPS New Lows recorded readings of 14, 19, 16, 10
and 12 with 6 breakdowns of 4+ week ranges, no valid trades and no close calls.
The “model†portfolio of trades meeting criteria
is now long
(
TRAD |
Quote |
Chart |
News |
PowerRating) (stopped out with profits)
(
GG |
Quote |
Chart |
News |
PowerRating) (stop under last
week’s lows if not stopped out already),
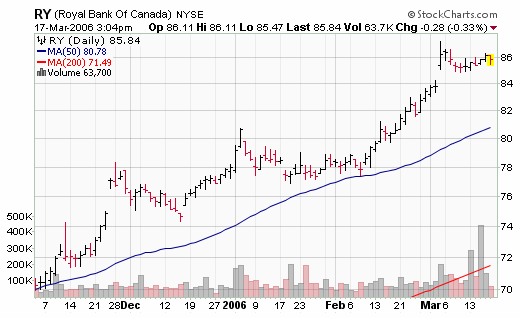
(
RY |
Quote |
Chart |
News |
PowerRating) (holding up well but tighten
stop),
(
RVSN |
Quote |
Chart |
News |
PowerRating) (stopped out with profit),
(
AXA |
Quote |
Chart |
News |
PowerRating) (use last week’s lows as
ops), TS (holding up well but tighten stop), and
(
MTU |
Quote |
Chart |
News |
PowerRating) (last month’s lows
must hold). Continue to tighten up trailing stops whenever possible on stocks
with open profits and strive to move stops to break-even or better as quickly as
possible in new entrants.
Mark Boucher has been ranked #1 by Nelson’s World’s Best
Money Managers for his 5-year compounded annual rate of return of 26.6%.
For those not familiar with our
long/short strategies, we suggest you review my book
The
Hedge Fund Edge, my course “The
Science of Trading,” my video seminar, where I discuss many new techniques,
and my latest educational product, the
interactive training module. Basically, we have rigorous criteria for
potential long stocks that we call “up-fuel,” as well as rigorous criteria for
potential short stocks that we call “down-fuel.” Each day we review the list of
new highs on our “Top RS and EPS New High List” published on TradingMarkets.com
for breakouts of four-week or longer flags, or of valid cup-and-handles of more
than four weeks. Buy trades are taken only on valid breakouts of stocks that
also meet our up-fuel criteria. Shorts are similarly taken only in stocks
meeting our down-fuel criteria that have valid breakdowns of four-plus-week
flags or cup and handles on the downside. In the U.S. market, continue to only
buy or short stocks in leading or lagging industries according to our group and
sub-group new high and low lists. We continue to buy new long signals and sell
short new short signals until our portfolio is 100% long and 100% short (less
aggressive investors stop at 50% long and 50% short). In early March of 2000, we
took half-profits on nearly all positions and lightened up considerably as a sea
of change in the new-economy/old-economy theme appeared to be upon us. We’ve
been effectively defensive ever since, and did not get to a fully allocated long
exposure even during the 2003 rally.
