Here’s my trading strategy for the S&P100
Charles Sachs has utilized S&P 100 for the past 14 years, both as a trader and an advisor. He uses 24 proprietary indicators in order to structure options strategies which can generate gains whether the market moves up, down or sideways. For a free trial to Charles Sachs’ Options Alerts click here or call 888 484-8220 ext. 1.
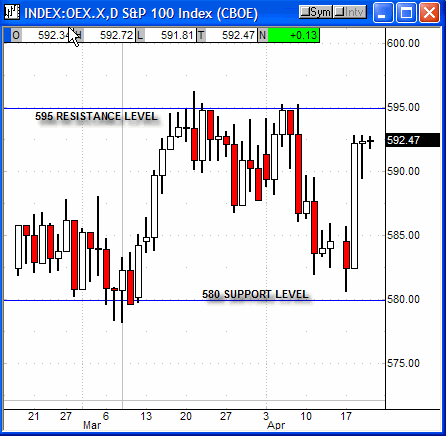
As evidenced by the chart below, the S&P 100 index has been trading in a range for the past two months between the 580 and 595 levels. As I am writing this article, the S&P 100 index is approaching the 595 resistance level. Accordingly, we would expect the S&P 100 index to decline in price and move back down towards the 580 support level. For a point of reference, the potential 15 point decline on the S&P 100 index would be the equivalent of about a 300 point decline on the Dow Jones Industrial index.

When financial markets are in a trading range, as outlined in the chart above, traders have the opportunity to formulate strategies using the time deprecation characteristics of options to give them a mathematical advantage to profit. Traders should also use the extremes of the outlined trading range above to enter and exit their trades opportunistically. Using the aforementioned strategies, our recommendations have accrued over 126% in profits (excluding brokerage fees) since July 2004, without a single losing trade recommendation. We have achieved these results while financial markets have traded narrowly.
Bottom Line: In the short-term, traders can look to execute short (or put) positions, or exit long positions, when the S&P 100 index attains the 595 resistance level. We would expect financial markets to do so and sell off in price shortly. One other note: I will be giving an online options seminar today at 11 a.m. EST. to discuss more fully the proper approach for trading options. Sincerely, Charles Sachs Chief Options Strategist.
