Here’s The Better Long Entry
Yesterday after four straight down weeks with lower highs and lower lows,
the SPX
(
$SPX.X |
Quote |
Chart |
News |
PowerRating) started off the
week with a close in the top of the range, but it wasn’t a wide-range bar with
volume, nor was it a change-in-direction bar, which would be a higher high and
low closing above the previous day’s high. NYSE volume was just 1.2 billion,
while the volume ratio was 66, and breadth +424.
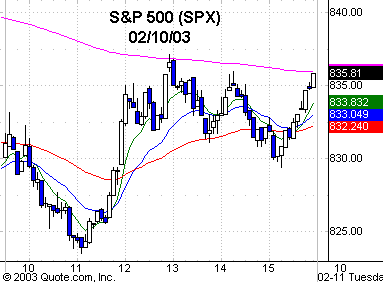
The SPX quickly reversed
after the opening few bars and traded down to an intraday low of 823.53 on the
11:05 a.m. ET bar, where it then rallied to an intraday high of 837.16 by 1:00
p.m. 823 is the .707 retracement to the October 768.63 low, and 827 is the .50
retracement to the 1982 low. It was an RST second-entry trade for those of you
that have attended the seminar or have purchased
the tapes. It fell off to 829.39 by the 3:15 p.m. bar, then rallied into the
close of 835.97.
On the day, the SPX
gained +0.8%, the Dow
(
$INDU |
Quote |
Chart |
News |
PowerRating) +0.7%, and the Nasdaq
(
$COMPQ |
Quote |
Chart |
News |
PowerRating) +1.1%.
The Nasdaq bounced off of 1275, the intraday low, and that was right at the
confluence mentioned in yesterday’s commentary from 1273 to 1266. It closed at
1294, right at the top of the range.
The
(
SMH |
Quote |
Chart |
News |
PowerRating)s advanced
+1.5%, rallying off the intraday low of 20.36 vs. the 20.25 .786 retracement to
the October low. The
(
QQQ |
Quote |
Chart |
News |
PowerRating)s have acted better than the
(
SPY |
Quote |
Chart |
News |
PowerRating)s or
(
DIA |
Quote |
Chart |
News |
PowerRating)s. They traded 104 million shares last Thursday with a 23.86 low, then
72 million on Friday with a lower low at 23.65. Yesterday the volume was once
again lower at 68 million with a 23.63 intraday low, but a higher close at
24.25, and that was before the late after-hours trading. I will look first to
the QQQs today if the Generals show up. For the QQQs, above 24.03 puts it above
the 20-period EMA on the 60-minute chart, and then there is the 24.27 .50
retracement to the October lows, and then the neckline and Dec. 31 low at 24.28.
As I said before, they closed at 24.25, so the game is on today.
The SPX closed above its
20-period EMA on the 60-minute chart, which is 835.46. The .618 retracement to
the October low is 839.55, so we’ve got a little overhead right in front of us.
It was interesting that
Newmont Mining
(
NEM |
Quote |
Chart |
News |
PowerRating) broke to the downside yesterday from a daily chart
symmetrical triangle, and the
(
TLT |
Quote |
Chart |
News |
PowerRating)s, which is the long-term bond proxy,
sold off from 88.52 to an 87.70 intraday low. There was certainly no panic
yesterday in those two war proxies.
We start our trading day
with the closing ranges from yesterday and the fact that for the last three days
in succession, the major indices have opened up, then after a few bars, reversed
to the downside. I see that the futures are green early, so if there is to be an
up day today, you should be ready for a pullback into the closing range after
the up opening if the futures hold. If there is a move out of the closing range
after the pullback, that would be the better long entry.
On the short side, I have
mentioned the immediate overhead inflection points that will become downside
pivots if any rally reverses. I will key on the 60-minute charts for that.
Have a good trading day.

Five-minute chart of
Monday’s SPX with 8-, 20-,
60- and 260-period
EMAs

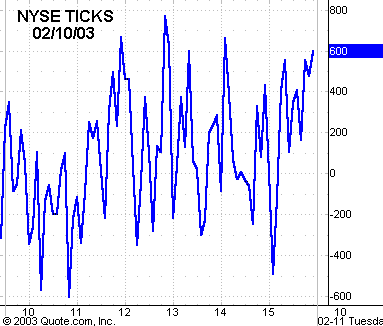
Five-minute chart of
Monday’s NYSE TICKS
