Here’s The Drill
It was
another soft day for the major indices
but with some selling pressure, as the
(
$SPX.X |
Quote |
Chart |
News |
PowerRating) opened and
closed below the previous day’s close and in the bottom of the range on a lower
high and lower low. There was also an increase in NYSE volume to 1.48 billion
while breadth was +248. The volume ratio was 43. This type of choppiness
indicates to me there was considerable option-expiration activity. Nevertheless,
it was down.
This current rally has
stalled right in our strong time period and at the .786 retracement zone which
is 936.13 for the SPX. There was the intraday double top the other day at
935.05. Yesterday’s low was 911.98. That double top was also just at the 1.0
standard deviation band, utilizing a three-month chart for the SPX, which I like
to always refer to. This rally started at the second standard deviation band on
12/31/02. FYI, the high close of the last rally which ended on 12/2/02 with the
954.28 intraday high, was 940.41 which was right on the 2.0 standard deviation
band. 954.28 was just below the 3.0 standard deviation band.
The three-month 2.0
standard deviation band is now about 950, which is also the 200-day EMA level.
The 3.0 band is right at the 965 level. Yesterday’s close of 914.60 is right on
the median price line. If there is continuation down, I get interested at the
2.0 band at about 897 with the 3.0 band around 860. Wednesday’s reversal bar put
the 833 slow stochastic below 80 on the short-term overbought level but it had
not been extended beyond the first standard deviation. There is more confluence
around 840 which is the .618 retracement level and 850 which is a Fib extension
zone if the SPX breaks the 869.45 low. The low of this recent eight-bar
consolidation is 908.32, and the .50 retracement between 954.28 and 869.45 is
911.86. The 20-day EMA is 911.39 with the 50-day EMA at 905 and the 89-day at
907.
I just took you through
exactly what I am observing at 6:30 a.m. ET this morning as I prepare for today.
I now have my market reference points and just have to watch for any setups on
the intraday charts around these levels that I have prepared in advance,
which helps prevent emotional trading on announced moves and the CNBC babble.
Next, it’s on to my stock
screens on the TradingMarkets site, looking at where the buying and selling
pressure was yesterday and then checking the daily charts for setups. If I like
something, I drop down to the 60-minute chart to see if there is an earlier
entry point prior to above or below the previous day’s high and low. I then
check the closing range on the 5-minute chart which will usually give you the
earliest possible entry. During this kind of market, I prefer looking for
consolidating volatility patterns waiting to resolve themselves in either
direction.The
(
BBH |
Quote |
Chart |
News |
PowerRating)s and
(
UTX |
Quote |
Chart |
News |
PowerRating) did it yesterday, as did
(
BHI |
Quote |
Chart |
News |
PowerRating) back
on 1/7/03. Scroll your charts. You will find them.
I will see you all on
Tuesday so enjoy the long weekend. I know I will with my delta neutral trade
already in motion. I go home this weekend knowing that if they start shooting,
it’s an air pocket down and if he decides on taking an extended vacation, the
market will scream to the upside for a few days. Either way, it’s win win. Go
get yourself an option education and there is no better place to start than with
our own Tony Saliba
Have a great weekend and a good trading day.

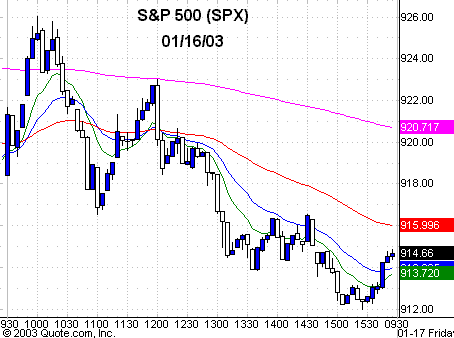
Five-minute chart of
Thursday’s SPX with 8-, 20-,
60- and 260-period
EMAs

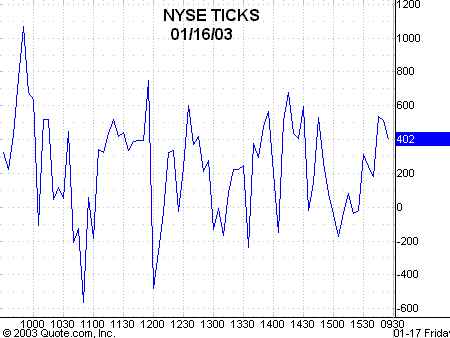
Five-minute chart of
Thursday’s NYSE TICKS
