Here’s the key to keeping drawdowns small in this market
For some time we’ve
talked about how global bonds have acted as a safety net that
prevented any significant decline from developing. So far in this decline, bonds
have not been able to act as a safety net and the degree of plurality both of
groups and countries taking place in the recent decline is thus sharply higher
than any since this bull market began.
US AND global bonds need to move higher in concerted fashion to buffet negative
forces here. They have not been able to do this in most cases because of fears
that inflation will pick up from higher energy and commodity prices and fears
that the US housing bubble is at least peaking and US consumption is turning
lower. Keep your eyes on bonds and on the global equity markets concerted
reaction to global bond moves here.
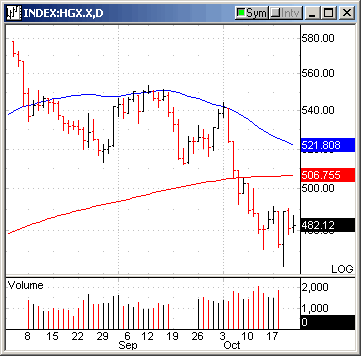
Continue to watch critical market sector tests as well. REITS are testing their
200 ma after having broken down from a multi-month Head and Shoulder top. A
strong volume rally off of this level would be positive, whereas a high volume
breakdown below the 200 ma would be quite negative. QQQQ’s fell below their 200
ma for a day and then bounced back on decent volume. A good volume move above
the 50 day ma would be positive, while a decline below last week’s low on volume
would be quite negative.
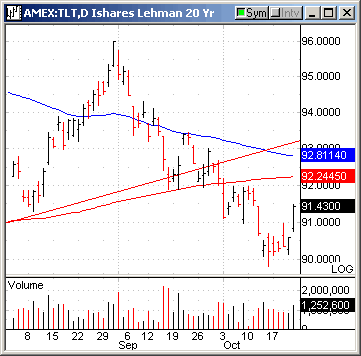
(
RTH |
Quote |
Chart |
News |
PowerRating) has held at 90 for now, but 85 support
remains critical.
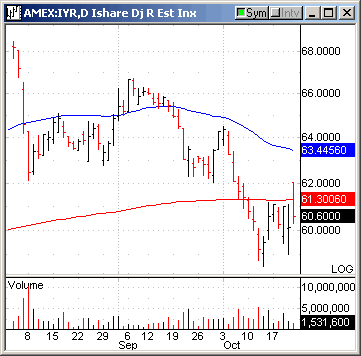
(
BKX |
Quote |
Chart |
News |
PowerRating) held at around 93 for now, but 90 remains long-term
critical support.
The dollar remains at a critical point as well. It tested the 91 level and the
July highs this week and is backing off some, though not with vigor. A strong
volume break above 91 will complete a two-year head and shoulder bottom, whereas
a strong volume decline below 88 would mean dollar strength may be over.
Oil prices broke down through and head and shoulder top as well last week and
look set to test 200 day ma and weekly support in the 56-58 zone.
(
XLE |
Quote |
Chart |
News |
PowerRating) is
already testing 200 day levels in the 44-45 zone, and
(
OIH |
Quote |
Chart |
News |
PowerRating) looks set to
test 200 ma and weekly support in the 100-104 area.
Along these lines commodity indexes are backing off and into correction. Gold
has backed off of the 400 EUR level and investors should take profits if this
week’s lows are taken out next week in gold, gold/EUR and gold/yen. It’s been a
nice run here, but if a real slowdown develops it will not be positive for gold
and the inflation worries can very quickly turn to deflation concerns.
For now we continue to advise caution and very low allocation even to hedged
portfolios and even for aggressive traders. It’s watch and wait for better odds
time here in our opinion.
Our model portfolio followed in TradingMarkets.com with specific entry/exit/ops
levels from 1999 through May of 2003 was up 41% in 1999, 82% in 2000, 16.5% in
2001, 7.58% in 2002, and we stopped specific recommendations up around 5% in May
2003 (strict following of our US only methodologies should have had portfolios
up 17% for the year 2003) — all on worst drawdown of under 7%. This did not
include our foreign stock recommendations that had spectacular performance in
2003.
This week in our Top RS/EPS New Highs list published on TradingMarkets.com, we
had readings of 10, 10, 25, 25, and 30 with 21 breakouts of 4+ week ranges, one
valid trade in
(
CVCO |
Quote |
Chart |
News |
PowerRating) and close calls in
(
AEG |
Quote |
Chart |
News |
PowerRating) and
(
LDSH |
Quote |
Chart |
News |
PowerRating). This
week, our bottom RS/EPS New Lows recorded readings of 107, 47, 33, 50, and 81
with 18 breakdowns of 4+ week ranges, no valid trades and one close call in
(
LFUS |
Quote |
Chart |
News |
PowerRating).
(
VLO |
Quote |
Chart |
News |
PowerRating) hit out stop on the long side and the “model†portfolio of trades
meeting criteria are now short
(
NDN |
Quote |
Chart |
News |
PowerRating) and
(
SUP |
Quote |
Chart |
News |
PowerRating). The environment is
getting trickier and more treacherous and we are chickens when it comes to
risking principle unless it looks like the weather is clear.
For those not familiar with our long/short
strategies, we suggest you review my book The Hedge Fund Edge. Basically,
we have rigorous criteria for potential long stocks that we call "up-fuel," as
well as rigorous criteria for potential short stocks that we call "down-fuel."
Each day we review the list of new highs on our "Top RS and EPS New High List"
published on TradingMarkets.com for breakouts of four-week or longer flags, or
of valid cup-and-handles of more than four weeks. Buy trades are taken only on
valid breakouts of stocks that also meet our up-fuel criteria. Shorts are
similarly taken only in stocks meeting our down-fuel criteria that have valid
breakdowns of four-plus-week flags or cup and handles on the downside. In the
U.S. market, continue to only buy or short stocks in leading or lagging
industries according to our group and sub-group new high and low lists. We
continue to buy new long signals and sell short new short signals until our
portfolio is 100% long and 100% short (less aggressive investors stop at 50%
long and 50% short). In early March of 2000, we took half-profits on nearly all
positions and lightened up considerably as a sea of change in the
new-economy/old-economy theme appeared to be upon us. We’ve been effectively
defensive ever since, and did not get to a fully allocated long exposure even
during the 2003 rally.
Defense time. Let’s watch the fireworks from the sidelines for bit. Remember
that one of the biggest keys to keeping equity market drawdowns low is to know
when the odds are NOT in your favor and the risk/reward is not so strong. That
looks like now to us.
Mark Boucher