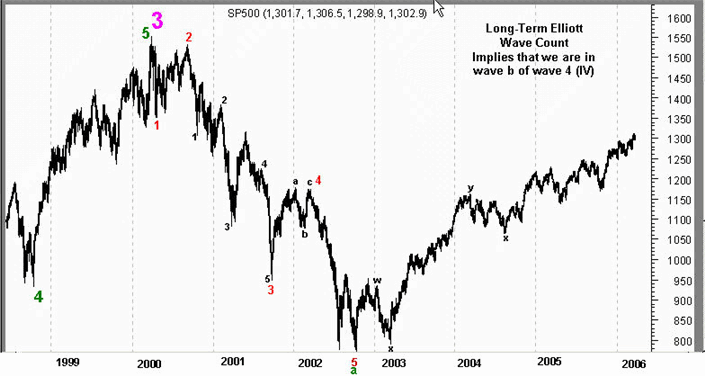
Here’s the latest Elliott Wave count for the S&P 500
Elliot Wave analysis is one of the ways that
technicians can monitor the market. It has many critics and is often viewed as
subjective. However, I do often like to look at the market in this context
because it can give a better view of where the market has been and where it
could possibly go.
In its’ very simplest form, Elliott Wave theory is just the concept that the
stock market moves in five waves with the prevailing trend and three waves
against the prevailing trend. The waves that move with the prevailing trend are
labeled 1,2,3,4,5 (or a variation thereof). Of those numbered waves, 2 and 4
correct 1 and 3. The waves that move against the prevailing trend are labeled
A,B,C (or a variation thereof), where B corrects A.
Where is the S&P 500 now based on conventional Elliott Wave Analysis? Below is a
yearly chart with labels:

This chart is from www.elliottwavemarkettiming.com and have that websites labels
on them. The “Daily Linear Scale Charts†as shown above are free. Subscribers
have access to intraday charts. As a dabbler in Elliott, I happen to agree with
how the chart has been labeled.
Let’s focus our attention to the year 2003 where
the green “a†is located. The implication of the “a†is that in 2003, wave a in
Cycle degree ended. This wave is part of larger Supercycle Wave 4. I am assuming
that this particular site is using purple numbers to denote Supercycle Degree.
It is not as terribly important to categorize the exact degree of cycle that we
are in as it is to understand in which wave structure we are operating with. My
logic is leading me to assume that the purple numbers denote Supercycle Degree.
Elliot wave technicians typically will use parentheses and roman numerals at
this degree. It would be (III) for example instead of purple 3.
Thinking about
it in a different way in order to jog the old memory, Supercycle Wave 3 was at
the height of the most recent raging bull market. It is often the case that wave
3s are the strongest and longest lasting so this makes perfect sense. This does
imply however that we have one more large rally left (Supercycle Wave 5) that
will likely take us past the highs of 2000. It is not easy to trade based on Supercycles for my time horizon, (Supercycle 3 lasted about 20 years), I need to
think in Primary and Intermediate Degree; however, this is giving me a nice
context in which to go further.
As I noted earlier, Cycle degree wave a ended in
2003. We are now in Cycle degree Wave b. Wave a was a fairly simple zig-zag
correction. Wave b is anything but simple (typical of B waves). We need to know
that wave b will end and that wave c is a down wave that could take up quite a
bit of time. It looks as if wave b is a type of correction called a “triple
three†in Cycle degree. A “triple three†is basically 3 threes’ joined together
with two other threes called Xs. The labeling is W-X-Y-X-Z. You can infer from
the chart above that the market has gone through waves W-X-Y-X, and we are
currently in wave Z (no label shown so not yet complete).
The current wave is
likely the last wave of the b correction. At this very moment, the market is
likely in wave Y (of wave Z) of a Double Three {two threes connected by one
three (W-X-Y)}. However, the double three could of course turn into a triple
three. Currently, I am trading within the provisions that the market is in a Supercycle 4 correction and that the Cycle b wave is closer to being finished
than it was at the beginning of the year. In the large context of things, this
implies that we will have a Cycle c wave (down) and then start a Supercycle 5
Wave (up). If you are interested in learning more about Elliott, I encourage you
to read
Elliott Wave Principle by A.J. Frost and Robert
Prechter.
Sara Conway is a
registered representative at a well-known national firm. Her duties
involve managing money for affluent individuals on a discretionary basis.
Currently, she manages about $150 million using various tools of technical
analysis. Mrs. Conway is pursuing her Chartered Market Technician (CMT)
designation and is in the final leg of that pursuit. She uses the Point and
Figure Method as the basis for most of her investment and trading decisions, and
invests based on mostly intermediate and long-term trends. Mrs. Conway
graduated magna cum laude from East Carolina University with a BSBA in finance.
