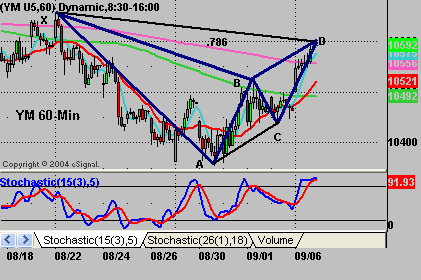
Here’s the next upside target level for the S&Ps
Stock index futures opened
the new week on a positive note, after brushing off the doom and gloom hurricane
news media that saturated the weekend. A quick test and hold of the open
price in the first 30 minutes had the makings for a trend day up after the ISM’s
non-manufacturing index showed expansion and crude oil futures took a tumble.
While any of a number of reasons could be thought up, the gains could also be
simply attributed to too many market players leaning the wrong way.

How Do You Handle the Down Time?
Intraday trading involves a lot of "down time"
during the day and I’ve received several emails asking how I handle it.
When I started doing this, I would be glued to my screens for 10 hours a day.
I simply can’t do that anymore, both physically and mentally. Physically,
this business can ruin your body if you let it, from the ergonomic hazards to
straining your eyesight. You must have outside interests to get your mind off
the markets. Sports, exercise, hobbies, meditation. I personally
look at focusing on the market for the first 2-1/2 hours up to noon ET, take off
for 2 hours, and then come back refreshed for the afternoon at 2 pm ET.
From a mental standpoint, it clears my head to get away and do something else
during lunchtime. Whether it be working out, running errands, reading,
playing with my dogs (I have 3), taking my wife out to lunch, whatever. It
also keeps me out of trouble by avoiding the temptation to trade a timeframe
that is personally susceptible to the most mistakes and the least reward/risk.
Daily Pivot Points for 9-7-05
| Symbol | High | Low | Close | Pivot | R1 | R2 | R3 | S1 | S2 | S3 |
| INDU | 10593.06 | 10447.69 | 10589.24 | 10543.33 | 10638.97 | 10688.70 | 10784.34 | 10493.60 | 10397.96 | 10348.23 |
| SPX | 1233.61 | 1219.52 | 1233.40 | 1228.84 | 1238.17 | 1242.93 | 1252.26 | 1224.08 | 1214.75 | 1209.99 |
| ES U5 | 1235.00 | 1219.25 | 1234.25 | 1229.50 | 1239.75 | 1245.25 | 1255.50 | 1224.00 | 1213.75 | 1208.25 |
| SP U5 | 1235.00 | 1223.50 | 1234.20 | 1230.90 | 1238.30 | 1242.40 | 1249.80 | 1226.80 | 1219.40 | 1215.30 |
| YM U5 | 10596.00 | 10486.00 | 10590.00 | 10557.33 | 10628.67 | 10667.33 | 10738.67 | 10518.67 | 10447.33 | 10408.67 |
| BKX | 99.53 | 98.45 | 99.36 | 99.11 | 99.78 | 100.19 | 100.86 | 98.70 | 98.03 | 97.62 |
| SOX | 474.83 | 468.01 | 474.71 | 472.52 | 477.02 | 479.34 | 483.84 | 470.20 | 465.70 | 463.38 |
Weekly Pivot Points for Week of 9-5-05
| Symbol | Pivot | R1 | R2 | R3 | S1 | S2 | S3 |
| INDU | 10436.83 | 10524.30 | 10601.22 | 10688.69 | 10359.91 | 10272.44 | 10195.52 |
| SPX | 1215.46 | 1229.85 | 1241.68 | 1256.07 | 1203.63 | 1189.24 | 1177.41 |
| ES M5 | 1214.17 | 1234.33 | 1248.92 | 1269.08 | 1199.58 | 1179.42 | 1164.83 |
| SP M5 | 1216.63 | 1231.57 | 1243.43 | 1258.37 | 1204.77 | 1189.83 | 1177.97 |
| YM M5 | 10439.33 | 10551.67 | 10640.33 | 10752.67 | 10350.67 | 10238.33 | 10149.67 |
| BKX | 97.99 | 99.41 | 100.43 | 101.85 | 96.97 | 95.55 | 94.53 |
| SOX | 467.91 | 473.53 | 479.64 | 485.26 | 461.80 | 456.18 | 450.07 |
Please feel free to email me with any questions
you might have, and have a great trading week!
Chris Curran
Chris Curran started his trading career at the
age of 22 with a national brokerage firm. He combines fundamentals and
technicals to get the big picture on the market. Chris has been trading for 15
years, starting full time in 1997, and has never had a losing year as a
full-time trader.
