Here’s the sector with the biggest upside
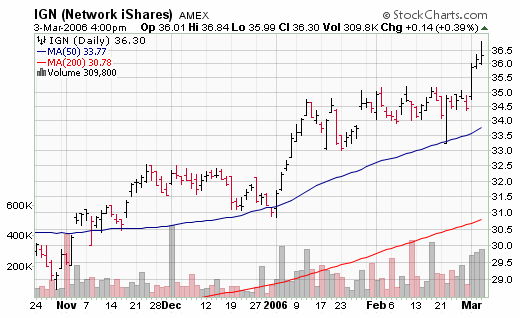
This week the entire
networking group broke out nicely from a monthly trading range, lead
by
(
CSCO |
Quote |
Chart |
News |
PowerRating), and
(
GLW |
Quote |
Chart |
News |
PowerRating). GLW is the stock that comes closest to meeting criteria, and
there is an i-share, IGN that captures the group. The group broke out in terms
of RS as well, and we will therefore add it to our leading group list.
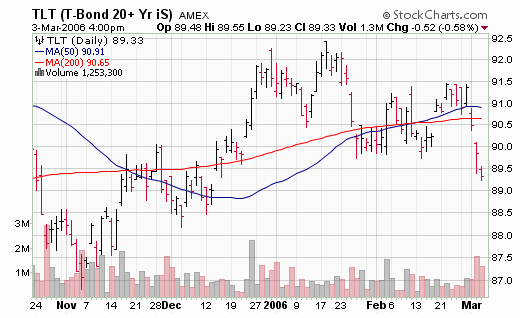
Investors should be on alert to the decline in
global bonds this week. The ECB’s tightening was no surprise, but what surprised
global and US bonds this week was the ECB’s comments following their rate hike.
Combining the ECB’s tough talk and stronger projected growth in Europe with the
huge surprise of stronger than expected Japanese growth on the week and a US
economy not yet slowing, and it hit the bond market. Note that the lows (watch
TLT and IEF) have NOT yet given way — so the higher inflation more tightening
than expected scenario we spoke of last week is not yet validated, though odds
improved this week. 10-year yields are testing critical levels in Japanese,
European, and US bonds due to this pressure, and investors are advised to watch
closely. New high yields in global bonds in concert could exert stronger
headwinds against stocks than we’ve seen in years, so keep your eyes open here.
The Yen situation is also becoming potentially
worrisome and deserves some explanation and monitoring. For many many years the
Japanese have held interest rates at nearly 0% rates to help stimulate their
economy. This has led to an ENORMOUS carry-trade position, whereby investors and
hedge funds borrow in Yen and take the proceeds and invest in higher yielding
currencies, gold, commodities, and anything likely to move. The ridiculously low
Yen rates have thus been a nearly free subsidy to any investment plan — leverage
for nothing practically AND with the implicit guarantee that BOJ would not let
the Yen appreciate much either. It’s been the best of both worlds then for
sandwiches — those strategies that borrow in cheap Yen and then invest in high
yielding currencies like the Brazilian Real, Icelandic Krona, New Zealand
dollar, and others. Thus despite the Yen being over 20% undervalued versus most
currencies in PPP terms, the short Yen position has grown to gargantuan
proportions.
Any time speculative positions grow to historic
levels, traders must take note and monitor the risks of a blow-up if these
positions were to suddenly unwind. We have noted this risk earlier. However the
recent comments by Mr. Fukui of the BOJ have again stirred some panic
liquidation in the Yen and some clear footprints of carry-trades starting to
unwind, such as in the Icelandic Krona. Investors need to understand that an
all-out panic unwinding of Yen shorts COULD severely impact nearly every market
that has been strong over the last few years. Further sharp appreciation in the
Yen and declines in Japanese bonds should lead investors to watch for unwinding
in other carry-trade currencies and in gold, commodities and even stocks if it
grows into a full-fledged panic. The more likely scenario is a slow steady
unwinding that is funded and slowed by the BOJ and that is accepted by the
Japanese stock market. A key difference so far between the sharp move in the Yen
of many weeks back and now, is that so far the Japanese stock market is not
reacting too negatively to the Yen rally. As long as this continues, the Yen can
continue to rally. Yet investors should not assume a benign outcome here — and
closely monitoring the interplay of the Yen, JJB’s, Japanese stocks, and
carry-trade beneficiaries is advised. A full-blown panic liquidation out of Yen
shorts could impact virtually all-global markets much as the 1998 Asian currency
crisis impacted global markets substantially.
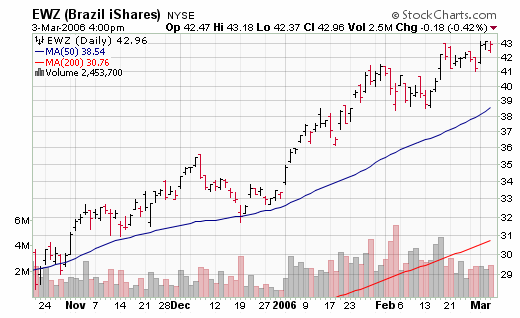
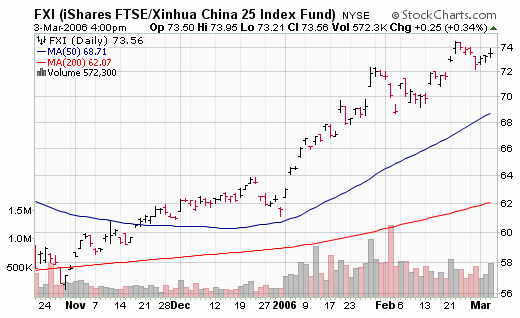
Therefore, with one eye squarely fixed on global
bond yields and the Yen as per above, we still believe focusing on stocks that
meet our rigid criteria along with the strongest themes is the best strategy for
this NARROWING market environment. Brazil, China, South Africa and health care
make up our favorite segments, with smaller suggested allocation to other
leaders such as networks (see above), commodity indexes, gold and gold stocks,
oil and oil stocks, and Telecoms.
Continue watching for tops and weak segments that
are making topping formations. Last week’s lows are holding thus far in
(
HHH |
Quote |
Chart |
News |
PowerRating),
(
GOOD |
Quote |
Chart |
News |
PowerRating),
(
AMZN |
Quote |
Chart |
News |
PowerRating), and
(
YHOO |
Quote |
Chart |
News |
PowerRating), but should the majority of these give way, investors
should take notice. Housing is still underperforming but is not yet breaking
down below 245.
(
RTH |
Quote |
Chart |
News |
PowerRating) and
(
XLY |
Quote |
Chart |
News |
PowerRating) have bounced and then retreated but not yet broken
significant level mentioned (93 and 32 respectively).
Since global equities and groups have
substantially outperformed US markets since the 2002 bull market began, we’ve
strived to discuss SOME of our favorite themes and global markets in addition to
simply following our basic US growth strategy of buying strictly only those
stocks meeting our rigid criteria and selling short those doing the same on
breakouts. So far over the last quarter or so, this simple strategy has done
quite well too.
We are continuing to suggest more than normal
caution and milder than normal allocation to top global themes, and for
investors to expect volatility and less than optimum markets. There are risks,
the Fed, ECB, and soon BOJ are all tightening, and a US housing-led slowdown may
be materializing. Therefore cautious exposure, trading in and out with minor
trends, is probably yet again the best approach to 2006.
Our model portfolio followed in
TradingMarkets.com with specific entry/exit/ops levels from 1999 through May of
2003 was up 41% in 1999, 82% in 2000, 16.5% in 2001, 7.58% in 2002, and we
stopped specific recommendations up around 5% in May 2003 (strict following of
our US only methodologies should have had portfolios up 17% for the year 2003) —
all on worst drawdown of under 7%. This did not include our foreign stock
recommendations that had spectacular performance in 2003.
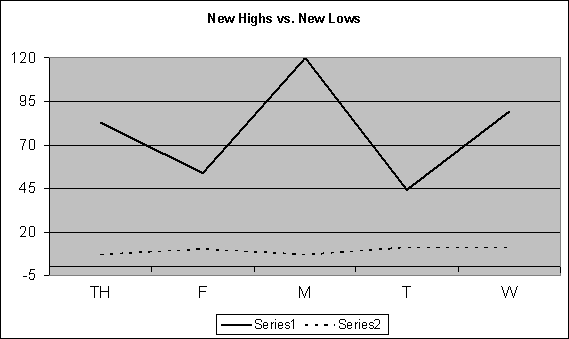
Over the past week in our Top RS/EPS New Highs
list published on TradingMarkets.com, we had readings of 83, 54, 120, 44 and 89
with 17 breakouts of 4+ week ranges, MTU & TS as valid trades and no close
calls. This week, our bottom RS/EPS New Lows recorded readings of 7, 10, 7, 11
and 11 with 4 breakdowns of 4+ week ranges, no valid trades and no close calls.
The “model†portfolio of trades meeting criteria is now long TRAD, CIB, GG, CHS
(stopped out), RY, RVSN, AXA, MVCO, TS and MTU. Continue to tighten up trailing
stops whenever possible on stocks with open profits and strive to move stops to
break-even or better as quickly as possible in new entrants. The list continues
to do very well.
Mark Boucher has been ranked #1 by Nelson’s World’s Best
Money Managers for his 5-year compounded annual rate of return of 26.6%.
Mark began trading at age 16. His trading helped finance his education at the
University of California at Berkeley, where he graduated with honors in
Economics. Upon graduation, he founded Investment Research Associates to finance
research on stock, bond, and currency trading systems. Boucher joined forces
with Fortunet, Inc. in 1986, where he developed models for hedging and trading
bonds, currencies, futures, and stocks. In 1989, the results of this research
were published in the Fortunet Trading Course. While with Fortunet, Boucher also
applied this research to designing institutional products, such as a hedging
model on over $1 billion of debt exposure for the treasurer of Mead, a Fortune
500 company.
For those not familiar with
our long/short strategies, we suggest you review my book
The Hedge Fund Edge, my course “The
Science of Trading,”
my video seminar, where I discuss many
new techniques, and my latest educational product, the
interactive training module.
 Basically, we have rigorous criteria
for potential long stocks that we call “up-fuel,” as well as rigorous criteria
for potential short stocks that we call “down-fuel.” Each day we review the list
of new highs on our “Top RS and EPS New High List” published on
TradingMarkets.com for breakouts of four-week or longer flags, or of valid
cup-and-handles of more than four weeks. Buy trades are taken only on valid
breakouts of stocks that also meet our up-fuel criteria. Shorts are similarly
taken only in stocks meeting our down-fuel criteria that have valid breakdowns
of four-plus-week flags or cup and handles on the downside. In the U.S. market,
continue to only buy or short stocks in leading or lagging industries according
to our group and sub-group new high and low lists. We continue to buy new long
signals and sell short new short signals until our portfolio is 100% long and
100% short (less aggressive investors stop at 50% long and 50% short). In early
March of 2000, we took half-profits on nearly all positions and lightened up
considerably as a sea of change in the new-economy/old-economy theme appeared to
be upon us. We’ve been effectively defensive ever since, and did not get to a
fully allocated long exposure even during the 2003 rally.
