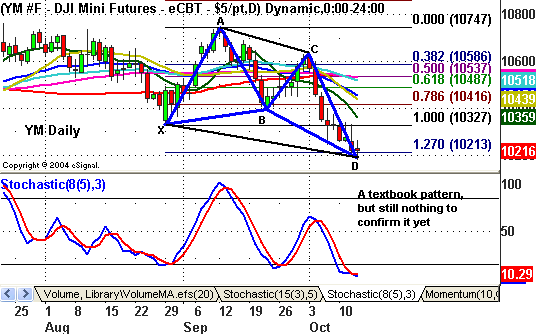
Here’s the textbook bullish pattern that’s forming
Stock index
futures opened Thursday’s session at the flat line after a wide overnight
range. For the 3rd day in a row, the futures shot higher off the
open, but quickly crapped out and fell into negative territory. A choppy range
contraction gave way to new session highs after the weekly energy supply numbers
came in as expected. But daily Pivot resistance proved to be too much and
as we’ve seen a lot this week, the sellers smelled blood. Breadth started
out horrible and despite the bounce attempt, remained weak throughout the
session.
The December
SP 500 futures closed out Thursday’s session at the flat line, while the YM
posted a couple ticks loss. Looking at the daily charts, the ES posted a doji
and bounced off the 1171 area, which is the 2nd reversal point of its bullish
Butterfly pattern. The YM also posted a doji and bounced off of its 1st
reversal point on its Butterfly. On an intraday basis, the 60-min descending
triangles broke and should now act as resistance if we see a bounce off of
bullish Stochs divergence. For you daily 3-Line Break followers, the ES remains
short with a new Break Price of 1190, while the YM remains short with a new
Break Price of 10323.
Â
The problem we’re having right now is that everyone
and their mother is saying how oversold the market is. When too many lean
to one side, the boat usually capsizes. Friday morning gives us a full
plate of economic reports, starting with the September CPI and Retail Sales at
8:30 ET, Industrial Production and Capacity Utilization at 9:15, the preliminary
Michigan Consumer Sentiment Index at 9:45, and August Business Inventories at
10:00.
Â
 Â Â Â Â Â Â Â Â Â Â Â Â Â Â Â Â Â Â
                 Â
What Made You Choose the Set-Up You Trade?
The set-up I’m most comfortable with and have
historically made the most money from consistently is a trend reversal/pullback
set-up (i.e. 3-Line Break). Largely I think my style comes from simply
getting my feet wet when I first started trading. My head was probably clearest
at this point and the first things seemed to have sunk in the most. So even when
I have traded other set-ups, I have always had trend pullbacks and reversal in
the back of my mind (for better or worse). Plus, this approach makes great
intuitive sense and reason to me, and is able to be applied over any timeframe
and any chart.
However, I have also played around with a few
other approaches over the last few years. Like clothes shopping, you need to try
it on for size and see how it fits. Everything from multi-day to weekly set-ups,
fundamental to technical analysis, mechanical systems to discretionary, and
simple chart patterns. Yet for some reason I seem most comfortable with
short-term, trend reversal/pullback-type trading. I’m not really sure why,
apart from I think this style suits my personality the best. It’s certainly NOT
that this is the only way to make money. For me, trading has been an experience
of learning too much and making things too complicated, only to throw out
everything but the most simplest elements.
Daily Pivot Points for 10-14-05
Â
| Symbol | Pivot | Â Â Â Â R1 | R2 | R3 | S1 | S2 | S3 |
| INDU | 10204.79 | 10253.12 | 10289.65 | 10337.98 | 10168.26 | 10119.93 | 10083.40 |
| SPX | 1174.87 | 1181.53 | 1186.23 | 1192.89 | 1170.17 | 1163.51 | 1158.81 |
| ES Z5 | 1178.08 | 1184.42 | 1190.83 | 1197.17 | 1171.67 | 1165.33 | 1158.92 |
| SP Z5 | 1177.97 | 1183.93 | 1189.97 | 1195.93 | 1171.93 | 1165.97 | 1159.93 |
| YM Z5 | 10219.33 | 10260.67 | 10306.33 | 10347.67 | 10173.67 | 10132.33 | 10086.67 |
| BKX | 93.65 | 94.35 | 94.75 | 95.45 | 93.25 | 92.55 | 92.15 |
| SOX | 442.97 | 450.33 | 454.33 | 461.69 | 438.97 | 431.61 | 427.61 |
Please feel free to email me with any questions
you might have, and have a great trading week!
Chris Curran
Chris Curran started his trading career at the
age of 22 with a national brokerage firm. He combines fundamentals and
technicals to get the big picture on the market. Chris has been trading for 15
years, starting full time in 1997, and has never had a losing year as a
full-time trader.
